
Agent observability: measuring tools, plans, and outcomes
Agent observability:what to measure, how to trace reasoning and tool calls, and how Portkey helps teams debug and optimize multi-step AI agents in production.
AI agents have evolved far beyond simple prompt–response flows. They plan, make decisions, invoke tools, and loop through reasoning chains before producing an output. This flexibility makes them powerful—but also makes them opaque.
When something goes wrong, you’re often left asking:
- Which tool failed?
- Did the plan make sense?
- Why did it stop midway or hallucinate a step?
Without visibility into how an agent thinks and acts, debugging becomes trial and error. Teams can’t tell whether performance drops stem from a faulty tool, poor reasoning, or an upstream API issue.
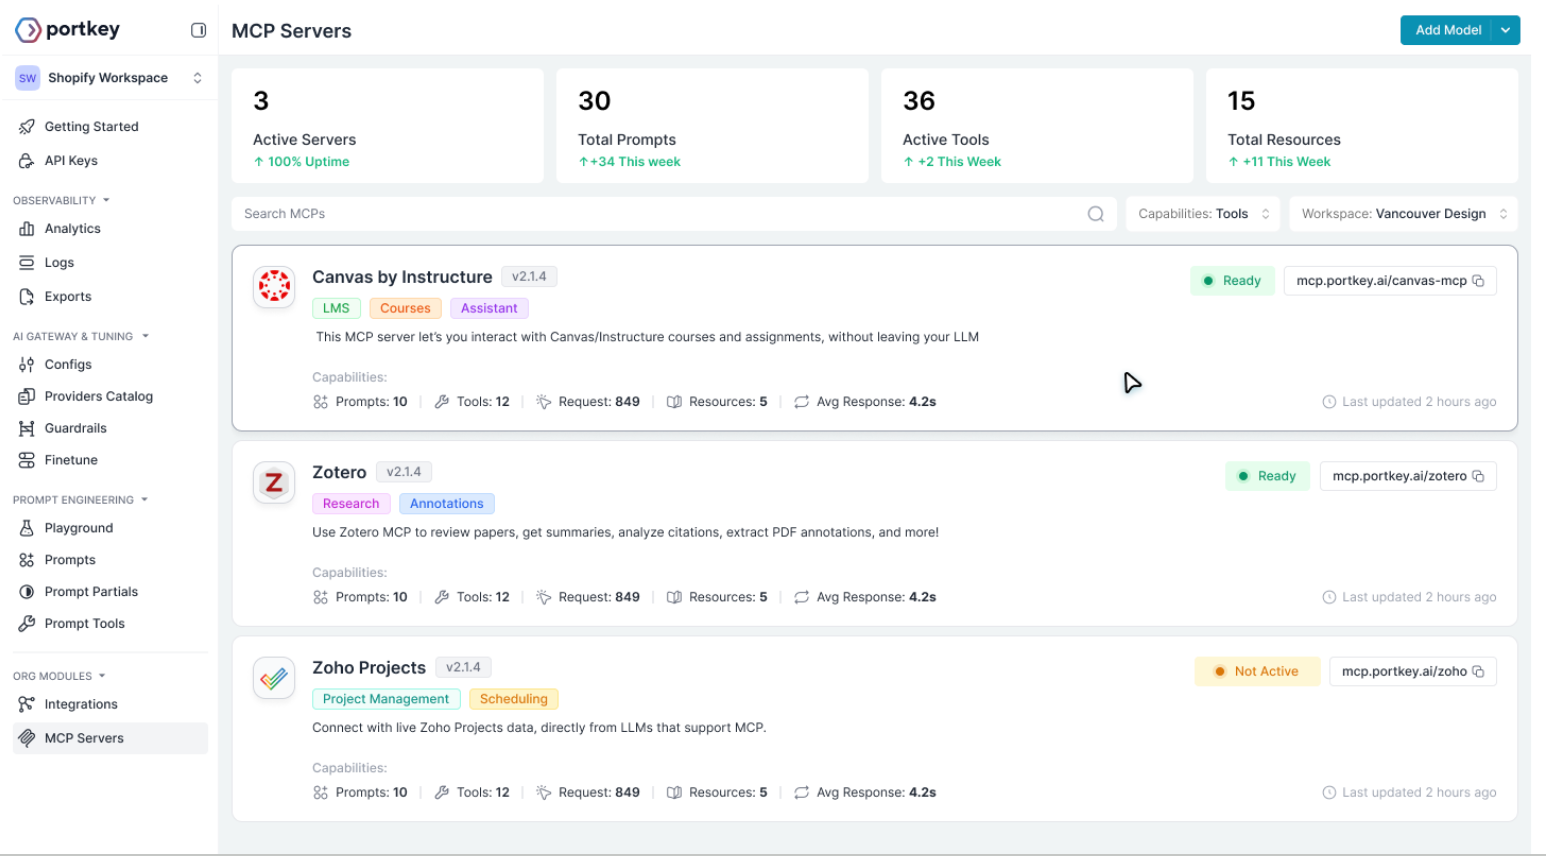
That’s why we built the MCP Gateway: a centralized control layer to run MCP-powered agents in production.
Check it out!
What makes agent observability different
Observability for standalone LLM calls is fairly linear: you track the prompt, response, latency, tokens, and cost. But agents don’t operate in a straight line. They think, plan, branch, retry, and call external tools—often several times within the same task.
This introduces three layers of complexity that traditional LLM observability doesn’t cover:
1. Planning transparency
AI Agents generate structured plans, break tasks into steps, and decide which tools to call. Without visibility into these intermediate states, you can’t tell whether failures come from flawed reasoning or from execution.
2. Tool-level execution
Tools behave like micro-services inside the agent loop: they have their own latency, error modes, inconsistent payloads, and dependency chains. Observability must surface how every tool performed—individually and in combination.
3. Outcome alignment
Producing an answer isn’t the same as producing the right answer. Agent observability tracks whether the final output actually matches the task objective, and how well the plan contributed to that.
In short:
LLM observability watches model behavior. Agent observability watches system behavior.
It connects the reasoning steps, tool calls, heuristics, and outcomes into a single trace, making it possible to understand not just what the agent did, but whether it did the right things along the way.
Key dimensions of agent observability
Agent observability extends beyond standard metrics, giving teams visibility into an agent’s planning, actions, and outcomes.
Planning visibility
The planning visibility dimension gives teams insight into the agent’s intended actions, its reasoning steps, and how it translates plans into execution.
- Intent vs. reality: Observability allows you to track the agent's internal "thought process," including the initial plan and decision-making steps, to understand its intended actions.
- Traceable steps: It provides the connective tissue to reconstruct the agent's path from the initial prompt to the outcome, making it clear which steps were taken and why.
Tool execution metrics
Tool execution metrics show which tools the agent invoked, how they performed, and where errors or delays occurred.
- Tool performance: This includes metrics on how tools are selected and executed, such as the accuracy of tool selection and the generation of correct parameters.
- Error propagation: Observability helps identify how failures cascade through the agent's workflow if a tool or API call fails, enabling faster troubleshooting.
Outcome validation
Beyond validating outcomes, effective observability links the agent’s actions across LLMs, APIs, databases, and tools to provide a complete picture of model performance.
- Measuring success: It provides a way to measure whether the final output successfully achieved the original goal by comparing it against quality criteria.
- Continuous improvement: This feedback loop of performance and outcome data is used to enhance agent capabilities over time, refining prompts, models, and other components.
Agent observability ties together every component the agent interacts with i.e. LLMs, APIs, databases, and external tools. Understanding these correlations is key to identifying failures, tracing outcomes, and capturing meaningful metrics for optimization. With these insights in mind, the next step is to explore the specific metrics teams should track to monitor and improve agent performance.
Five key metrics to track planning, tools, and outcomes
Key metrics for tracking planning, tools, and outcomes are of five categories, which represent a comprehensive framework for evaluating the performance and quality of AI models, particularly in the context of agentic systems that use tools and execute multi-step plans. Below is a detailed breakdown of the specific agent observability measurements.
Along with these, teams should also consider additional signals such as reliability under load, drift over time, safety and compliance checks, and business impact metrics. With these insights, the next step is understanding how to trace agents effectively to connect reasoning, tool usage, and outcomes across multi-step workflows.
From metrics to optimization
Once you have visibility into how an agent plans, calls tools, and arrives at outcomes, the next step is using those signals to improve performance.
- Start with the common failure patterns.
Metrics like high tool error rates, frequent retries, or excessive branching often point to structural issues in the agent’s workflow. Fixing these improves stability without touching the model. - Identify slow or unreliable tools.
Tracing reveals which tools consistently add latency or degrade accuracy. Replacing or optimizing these tools—or routing around them—has an immediate impact on end-to-end performance. - Tighten the agent’s reasoning patterns.
If the agent takes unnecessary steps or loops through unclear reasoning, adjust prompts, constraints, or the planning logic. Observability makes these inefficiencies obvious. - Link outcomes back to decisions.
By correlating evaluator scores and user feedback with specific reasoning steps or tool calls, you can tune the agent toward paths that produce reliable results.
In short, observability gives you a direct feedback loop:
measure → diagnose → optimize → validate.
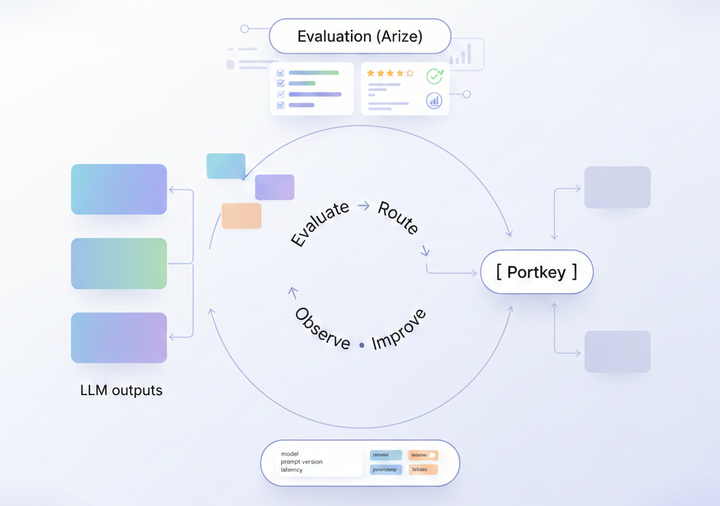
How Portkey does this
Portkey captures agent behavior end-to-end by treating every reasoning step and tool invocation as part of a single trace. Instead of stitching logs across multiple systems, teams get a unified view of how their agents think, plan, and execute.
Structured logs for every call
Each tool invocation—whether it’s an API call, tools calls, or internal function—passes through the AI Gateway. Portkey records latency, inputs, outputs, retries, and errors automatically, making it easy to spot slow or unreliable components.
Visibility into reasoning
When agents have multi-step reasoning, Portkey links those steps under a single session. You can see how the agent broke down the task, which tools it selected, and where the plan diverged or stalled.
MCP-native tracing for agent systems
With Portkey’s MCP connectors, agent frameworks can send structured events for tool calls, tool results, and plan updates. These are tied together using consistent trace IDs, so the entire workflow, from intent to final output appears as a coherent timeline.
Dashboards built for agent workloads
All spans, metrics, and outcomes stream into real-time dashboards. Teams can monitor tool reliability, detect recurring failure patterns, track cost per agent run, and debug complex reasoning flows without sifting through raw logs.
Governance and outcomes in the same stream
Because tool events, reasoning steps, guardrail checks, and evaluations are combined inside the same trace, teams get both performance visibility and governance visibility in one place. This means you can measure not just how an agent performed, but whether it stayed within policy and produced the expected outcome.
Portkey brings all the moving pieces of an agent system into one observability model, making it easier to understand behavior, improve reliability, and scale these workflows confidently.
Bringing it all together
As agents take on more complex tasks, observability becomes the only reliable way to understand how they behave in production. Clear visibility into plans, tool calls, and outcomes turns debugging into a faster, predictable process and gives teams the insight they need to improve accuracy, reduce errors, and keep systems stable.
Portkey already provides this foundation. With unified traces, MCP-native tool logging, and dashboards built for multi-step agents, teams can move from opaque workflows to fully measurable ones—without changing their stack.
If you want to see how agent observability works in practice or explore how Portkey fits into your AI platform, you can book a demo with our team anytime.