Why connecting OTel traces with LLM logs is critical for agent workflows
Disconnected logs create blind spots in agent workflows. See how combining OTel traces with LLM logs delivers end-to-end visibility for debugging, governance, and cost tracking.
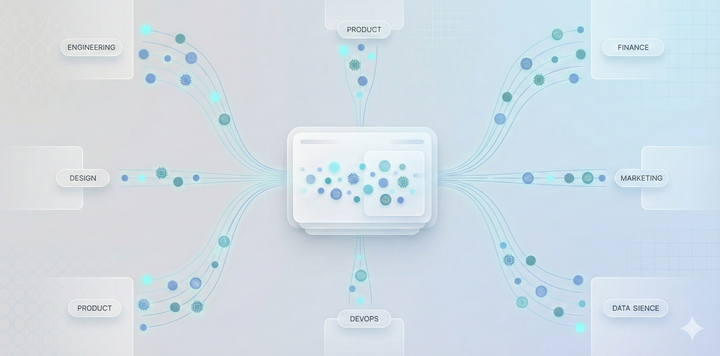
Modern AI agents orchestrate a chain of actions: invoking APIs, writing to databases, calling external tools, and passing data between systems.
But LLM interactions often sit outside of this ecosystem. They’re logged separately, if at all, and not tied back to the broader telemetry data. This creates a serious blind spot.
Why this matters for agents
Agent workflows are only as strong as the visibility behind them. If LLM calls and system traces remain disconnected, teams run into three major challenges:
Debugging. When something breaks, it’s rarely just the model at fault. An LLM might generate the wrong function call, an API could time out, or a query may return an unexpected result. Without linking the triggering LLM call to the subsequent system traces, debugging turns into guesswork across multiple silos.
Governance. Guardrails and compliance policies can’t stop at the model boundary. True governance means tracking and enforcing rules across the entire lifecycle of an agent: from the prompt, to the tool calls it initiates, to the responses returned. Otherwise, risks slip through the cracks.
Costs & performance. While usage-based billing starts with the LLM, efficiency (and wasted spend) depends on the full workflow. Retries, tool overhead, and cascading failures all contribute to cost and latency. Without end-to-end observability, optimization is incomplete.
How OTel helps and where it falls short today
OpenTelemetry (OTel) has become the industry standard for application observability. It gives teams a common way to collect traces, metrics, and logs across the stack from frontend services to backend APIs, databases, and infrastructure. With OTel, engineering teams get a unified view of how their systems behave.

But OTel wasn’t designed with AI-native workloads in mind. Out of the box, it doesn’t capture or correlate the unique data generated by LLM interactions: prompts, completions, token usage, costs, or retries. These events often remain in separate logs or custom dashboards, disconnected from the traces OTel is already collecting.
This leaves a critical gap. When an LLM output leads to a tool call or API request, OTel may record the system behavior but the “why” behind it (the model’s reasoning and inputs) is missing. Without this connection, the story of what actually happened is incomplete.
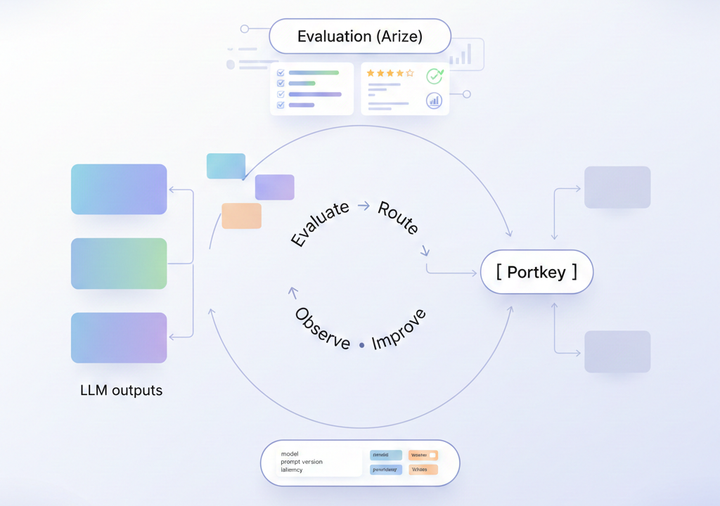
Portkey’s approach: bridging the two worlds
Portkey extends observability by connecting the dots between OTel traces and LLM interactions. With OTel-based auto-instrumentation, teams can send their existing system telemetry into Portkey, where it’s automatically combined with the detailed LLM call logs captured by the Gateway.
This creates a single, connected stream of observability data. Instead of jumping between dashboards or trying to manually stitch logs together, you get one place to see:
- Unified visibility: LLM calls and system telemetry in a single view.
- Correlation: Model prompts, completions, and costs tied directly to the traces they triggered.
- Insight: End-to-end performance, cost, and compliance data across the entire workflow.
By bridging the two worlds, Portkey turns fragmented logging into a coherent story of how agents operate in production.
Why this is especially powerful for agentic workflows
Agents live at the intersection of LLM reasoning and system execution. A single agent request can set off a chain of events:
- The LLM interprets the user query.
- It decides to trigger an API call.
- The API fetches data.
- The result is passed back to the agent, which may trigger another tool call.
- The agent aggregates results and formulates a response.
Each of these steps carries latency, cost, and potential points of failure. Without connected observability, it’s almost impossible to trace the lifecycle end-to-end.
With Portkey, every part of this flow is captured and correlated. You don’t just see that an API failed, you see which LLM prompt triggered it, how many retries occurred, what it cost, and how long it took. The entire lifecycle is visible in one place.
For agentic workflows, this changes the game. Debugging becomes faster, governance more reliable, and cost analysis more accurate. Instead of fragmented logs, you have a true agent timeline from model decision to system response.
Bringing OTEL+ LLM observability together
As agents evolve, their workflows will only get more complex. Without a connected observability layer, managing this complexity becomes unscalable.
The future of agent operations depends on end-to-end visibility: every prompt, every tool call, every trace stitched into one narrative.
Portkey is building toward this future. By combining LLM observability with OTel-based system telemetry, we’re creating a platform where teams can not only monitor but also govern, route, and apply guardrails across the entire agent lifecycle.
Ready to close the observability gap in your agent workflows? See how you can set up OTel with Portkey today or book a detailed walkthrough with us.