

The complete guide to LLM observability for 2026
Learn how to build complete LLM observability, from tracing and guardrails to cost and governance with frameworks and examples from Portkey.
Large language models are now critical to how organizations build products, automate workflows, and power intelligent assistants. But as these systems move into production, leaders face a familiar question with new complexity:
How do we know what’s really happening inside our AI applications?
LLM observability provides that answer.
It’s the discipline of collecting, correlating, and interpreting signals across every model interaction — prompts, tools, retrievals, guardrails, and costs — to understand performance, reliability, and risk in real time.
This guide lays out the principles, frameworks, and practical patterns enterprises use to operate AI systems with confidence.
That’s why we built the MCP Gateway: a centralized control layer to run MCP-powered agents in production.
Check it out!
What is LLM observability
LLM observability is the ability to understand and explain every interaction between users, models, and tools—across prompts, retrievals, and outputs—in order to ensure accuracy, reliability, safety, and cost efficiency.
Where traditional observability answers “Is my system up?”, LLM observability asks:
- Did the model produce a correct or grounded answer?
- Was that answer safe and compliant?
- How much did it cost to get there?
- If it failed, why and what should happen next?
The difference: monitoring vs observability
| Monitoring | Observability |
|---|---|
| Tracks known metrics (latency, errors, throughput) | Surfaces unknowns and root causes behind model behavior |
| Answers “Is it working?” | Answers “Why did it behave that way?” |
| Suited to infrastructure | Suited to reasoning systems (LLMs, agents, retrievals) |
| Reactive | Diagnostic and predictive |
Monitoring vs observability: Monitoring tells you that requests are flowing; observability tells you whether those requests produced trustworthy outcomes.
Why observability matters for LLMs
LLM-driven systems fail in new ways:
- Silent errors: the model returns confident but wrong answers.
- Drift: performance degrades as context, data, or fine-tuning evolves.
- Unbounded cost: token growth and retries inflate spend unexpectedly.
- Opaque reasoning: tool calls or routing decisions are hard to audit.
- Compliance gaps: missing lineage or PII traceability prevents governance.
Without observability, these failures go unnoticed until they show up in user experience or bills.
Core goals of LLM observability
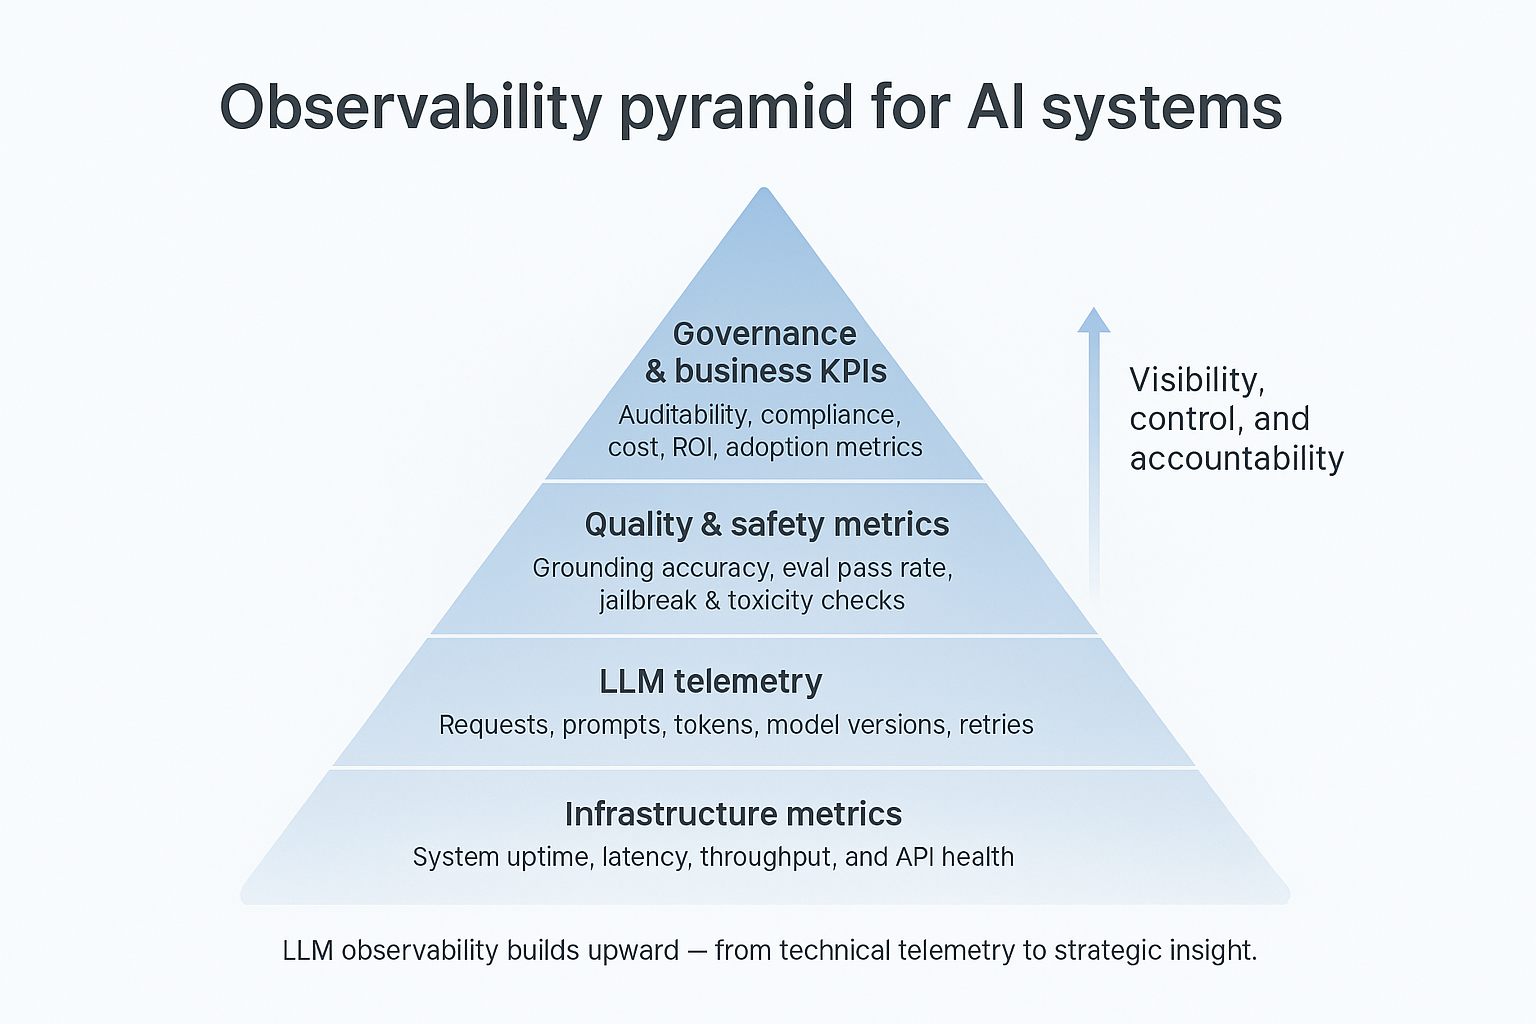
- Reliability: Detect and reduce latency, rate-limit, and provider failures.
- Quality: Measure factual accuracy, grounding, and eval performance.
- Safety: Monitor jailbreaks, toxicity, and PII leaks in real time.
- Cost: Track token usage, retries, and budget adherence.
- Governance: Ensure every request is traceable and auditable.
Each of these layers depends on structured telemetry flowing from your LLM gateway, tool ecosystem, and applications.
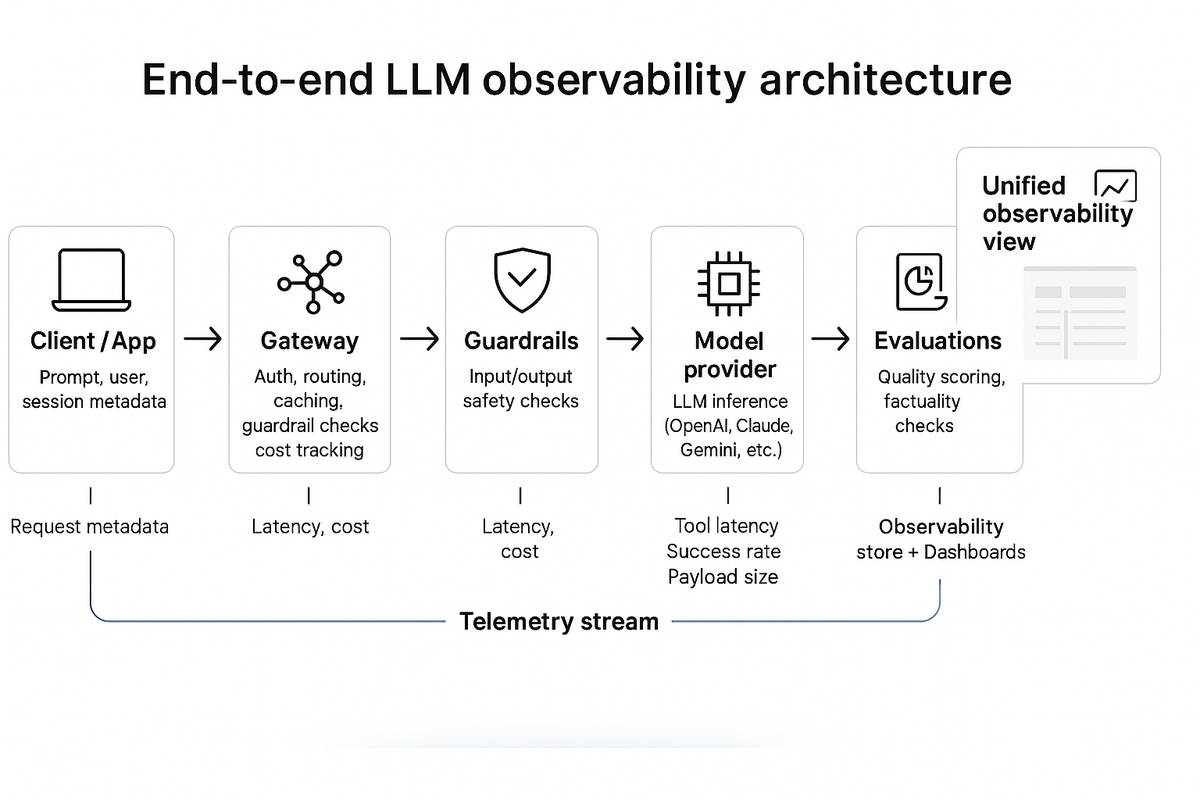
Reference architecture
LLM observability starts with a clear understanding of the moving parts behind every request.
From user input to model response, each hop generates data that forms the backbone of observability.
The core components
- 1. Client or application layerWhere prompts originate — web app, internal tool, or API consumer.Sends context (user, session, workspace) to the gateway for trace correlation.
- 2. AI gateway or proxyThe control plane for authentication, routing, rate limits, caching, and guardrails.Captures request metadata, latency, model choice, and cost.Enforces policies and forwards enriched telemetry to the observability stack.
- 3. Model provider(s)Any hosted or self-managed LLM endpoint (OpenAI, Anthropic, Azure OpenAI, etc.).Emits response-level metrics: completion latency, token counts, error codes.
- 4. Tools and function calls (MCP / external APIs)Execute actions during agent runs.Produce fine-grained traces: tool latency, success rate, payload size, errors.
- 5. Guardrails and moderation servicesValidate safety, compliance, and content quality.Emit verdicts (pass/fail), category, and severity.
- 6. Evaluation and scoring systemsBatch or online evals that rate factuality, relevance, and helpfulness.Feed continuous quality signals back into dashboards and routing logic.
- 7. Observability data store and visualizationCentral log or telemetry sink (OpenTelemetry, ClickHouse, ELK, or custom).Correlates traces by
request_idand aggregates KPIs.Surfaces dashboards, alerts, and audit views.
Data flow
- User request → Gateway
Metadata captured:user_id,workspace, prompt hash, input tokens. - Gateway → Guardrails
Checks input safety; adds verdict. - Gateway → Model Provider
Logs retrieval latency, docs count, and model call duration. - Model → Tools/ MCP calls
Each call becomes a sub-span with tool name, latency, and success flag. - Model → Output Guardrails → Client
Output moderation and cost calculation; response returned with full trace ID. - Telemetry Exporter → Observability backend
Sends batched spans, metrics, and events for analysis and visualization.
What good LLM observability looks like

- End-to-end traceability: Each request and sub-component visible in one timeline.
- Correlated dimensions: Model, user, tool, workspace, and cost joined together.
- Unified schema: Common field names across logs and metrics.
- Real-time visibility: Dashboards update within seconds of request completion.
- Governance alignment: Audit trail includes who accessed what data and why.
Telemetry model and schema
Every observable AI system depends on consistent, structured data.
A unified telemetry model ensures that logs from your gateway, tools, retrievals, and models can be correlated into a single view of reliability, cost, and quality.
At its core, LLM observability tracks three types of signals:
- Traces — every request path across prompts, retrievals, tools, and guardrails
- Metrics — aggregated performance, cost, and quality measures
- Events — safety or governance alerts that require review
All of them connect through a shared trace or request ID, forming one coherent record of what happened, why, and how much it cost.
Key telemetry categories
1. Identification and correlation
Capture unique IDs for every request and sub-operation so you can link user sessions, tool calls, and retries to the same trace.
2. User and workspace context
Record which user, team, or workspace triggered the request. This enables per-tenant dashboards, cost attribution, and usage auditing.
3. Model and provider details
Include model name, provider, and version to measure consistency, performance variance, and regression after upgrades or routing changes.
4. Prompt and context metadata
Track which prompt template or context window was used, and how large it was. This becomes essential for analyzing quality drift and token usage.
5. Performance metrics
Measure latency, retry counts, cache hits, and throughput across each span—gateway, retrieval, model, and tools.
6. Token and cost metrics
Log input/output token counts, total cost, and derived ratios (cost per response, per success, or per token). This data feeds cost observability and budgeting.
7. Guardrail and safety signals
Store guardrail verdicts, categories (PII, toxicity, hallucination), and severity levels to monitor adherence to safety and policy controls.
8. Tool and MCP telemetry
Track which tools were invoked, how long they took, success rates, and failures. Critical for agent observability and debugging tool chains.
9. Evaluation outcomes
Store evaluation dataset names, scores, and pass/fail results to connect observability metrics with quality benchmarks.
10. Governance and residency attributes
Record region, data-handling tags, and policy indicators for compliance and audit readiness.
11. Error and fallback information
Include error codes, messages, and retry reasons to support incident response and provider-side accountability.
Why standardization matters
- Enables cross-team dashboards where reliability, cost, and safety metrics align.
- Simplifies analysis, since every request follows the same schema.
- Provides a single data model that supports engineering, governance, and finance use cases without duplication.
- Makes multi-provider routing auditable and explainable.
Observability KPIs for LLM systems
Once telemetry is in place, teams can turn raw data into meaningful performance standards.
The right key performance indicators (KPIs) align technical health, model quality, and business outcomes.
KPI categories for LLM observability
1. Reliability KPIs
Measure the system’s ability to respond successfully and consistently.
- Success rate (% of 2xx-equivalent responses)
- P95 latency and variance
- Rate-limit hit frequency
- Provider uptime and failover success
- Retry count per request
2. Quality KPIs
Gauge how accurate, grounded, and helpful model outputs are.
- Evaluation pass rate (factuality, relevance, correctness)
- Retrieval grounding success rate
- Human acceptance or QA score
- Regression delta after model updates
3. Safety KPIs
Ensure responsible and policy-compliant outputs.
- Guardrail pass rate
- Jailbreak / PII / toxicity incident frequency
- False positive vs false negative ratios in moderation
- Time to detect and resolve safety breaches
4. Cost KPIs
Track efficiency and budget adherence.
- Average cost per request / per user / per workspace
- Token usage by model and provider
- Cost per successful completion
- Monthly spend vs budget threshold
5. Governance KPIs
Link observability with audit and compliance readiness.
- Percentage of requests with full trace coverage
- Requests tagged with data residency or policy labels
- Audit completeness (requests with lineage and trace metadata)
- Number of unclassified or missing-trace events
Tracing and logging patterns
Metrics summarize system health, but traces and logs explain behavior.
For LLM systems, where reasoning spans multiple components, tracing becomes the backbone of observability. It lets you see every hop, understand latency sources, and correlate outcomes with cost and safety signal.
A single trace can answer questions like:
- Which guardrail failed for this request?
- Did the model retry or fallback to another provider?
- Which tool call caused the slowdown?
- How much did this exact output cost?
Core tracing principles
1. End-to-end coverage
Every request, from prompt to response, must have data for the gateway, model, retrieval, tools, and guardrails.
2. Semantic consistency
Use a shared schema for attributes (latency, model name, tool name, tokens, cost) so traces are comparable across providers and environments.
3. Hierarchical view
Logging best practices
- Structure over text: emit JSON logs or structured events that match trace attributes.
- Include correlation IDs: always log
trace_id,span_id, and user/workspace identifiers. - Time-stamp everything: with high-precision timestamps (ms).
- Log once per logical step: avoid duplicating spans for the same event.
- Redact safely: mask PII and user inputs while preserving context for debugging.
Agent observability: measuring tools, plans, and outcomes
Agents reason, plan, and act through multiple steps, tools, and sub-decisions. This flexibility makes them powerful but also difficult to monitor. A single “API success” metric doesn’t capture whether the agent’s plan was efficient, correct, or even completed.
What to measure:
| Dimension | Metrics to capture |
|---|---|
| Planning | • Number of reasoning steps per task • Depth of plan tree (nested sub-goals) • Step-to-goal ratio (efficiency) • Abandonment or loop rate |
| Tool execution | • Tool latency and variance • Success vs failure rate • Retry count per tool • Error category (timeout, schema, logic, auth) • Cost per tool call |
| Outcome quality | • Task completion rate • Evaluation or correctness score • Confidence alignment between reasoning and result • Consistency across reruns |
| Context & tokens | • Token growth across steps • Context drift or truncation • Average context window utilization |
| Cost & performance | • Total execution time per agent run • Cost per completed goal • Cost per successful tool call |
Every agent run should be treated as a root trace, with each step or tool execution as a child span.
Attributes to include:
trace_id: shared across the entire reasoning cyclespan_name: plan, execute, evaluate, or tool nameiteration: to capture step orderlatency_msandcost_usdstatus: success, fail, retry
Guardrails and evaluations
Guardrails act in real time, preventing unsafe or non-compliant behavior before responses reach the user. Evaluations act in batches, testing large sets of prompts or models to measure reliability, grounding, or bias over time.
| Layer | Purpose | When it runs | Example signals captured |
|---|---|---|---|
| Guardrails (runtime) | Enforce safety and policy boundaries | During each request | Verdict (pass/fail), category (PII, jailbreak, toxicity), severity, fallback action |
| Evaluations (batch) | Measure model quality and factuality | On scheduled test sets or deployments | Score, dataset version, pass rate, regression delta |
A shared observability pipeline lets teams:
- Compare real-time guardrail failures
- Identify high-risk areas that require deeper evaluation
- View both safety and quality signals in a unified dashboard
AI cost observability
Different models, providers, and retries can multiply spend without a clear link to business value. Cost observability brings transparency to this layer, connecting usage, efficiency, and outcomes across every model interaction.
| Dimension | Metrics to capture |
|---|---|
| Usage | • Input/output tokens per request • Requests per user, workspace, or project • Cache hit vs miss rates |
| Cost efficiency | • Cost per successful request • Cost per token or per eval pass • Cost variance by model/provider |
| Routing behavior | • Percentage of requests per provider |
| Budgets and limits | • Monthly or team-level cost ceilings • Rate of budget consumption • Alerts for nearing overruns |
| Anomalies | • Sudden cost spikes by user or model • Token inflation from prompt/template drift • Unusual retry patterns |
A cost observability dashboard should answer:
- Where is spend coming from? (model, workspace, provider)
- How efficient are completions? (cost per success)
- What trends are emerging? (daily or weekly drift)
- Which changes caused the spike? (new model, routing change, longer context)
Good practices for cost control:
- Set budgets at team, workspace, or API key level.
- Track to the request-level for auditing and showback.
- Apply routing logic that balances price and latency dynamically.
- Cache responses for repetitive workloads.
- Automatically downgrade to cheaper providers for non-critical paths.
Incident response for LLM systems
The difference between a disruption and an outage is how quickly your system detects, isolates, and mitigates the issue. That’s the role of incident response within LLM observability.
Common incident types include:
- Provider failures: 429 (rate limits), 5xx (downtime), schema or API changes
- Performance degradation: latency spikes, token inflation, or retry storms
- Quality drift: factuality or grounding scores drop across evals
- Safety breaches: guardrail or moderation failures in production
- Cost anomalies: runaway spend from retries or context bloat
Implementation roadmap
- Phase 1 – Foundation: Start logging requests and responses with consistent trace IDs for basic visibility.
- Phase 2 – Structure and dashboards: Standardize telemetry fields and visualize reliability and cost trends.
- Phase 3 – Quality and safety: Add guardrails and evaluations to measure accuracy and compliance.
- Phase 4 – Agents and routing: Trace reasoning steps, tool calls, and multi-model routing behavior.
- Phase 5 – Governance and automation: Embed lineage, budgets, and automated alerts for a governed observability program.
Portkey’s approach to LLM observability
Portkey has been recognized as one of the Gartner® Cool Vendors™ in LLM Observability (2025) — highlighting its focus on making AI systems transparent, governable, and production-ready.
Portkey provides observability natively within its AI Gateway, allowing teams to trace every model interaction across providers, users, and workspaces. Reliability, cost, safety, and quality data are unified in one view — enabling engineers and governance teams to track usage, enforce guardrails, and respond to issues in real time.
With built-in support for metrics, dashboards, and OpenTelemetry-based tracing, Portkey turns observability from an afterthought into a core operating layer, helping enterprises run AI workloads with accountability and confidence.
As AI adoption scales, observability becomes the foundation for everything that follows: governance, auditing, optimization, and ultimately confidence in production outcomes.
If your team is moving AI workloads into production, get the fastest path to full visibility and control with Portkey. See how we're doing it for teams at Snorkel AI and Doordash, or book a demo with us here.