
What is AIOps?
LLM systems can fail in ways that never show up on a dashboard. Latency is fine, error rates are steady, infrastructure is green — and yet outputs are drifting, costs are climbing, and nobody can point to why.
This is the gap most teams hit as they move AI from prototype to production. Traditional monitoring tells you whether your systems are running, not whether they're behaving correctly. Requests succeed, but you can't see which model decisions drove a cost spike, why output quality shifted after a config change, or whether a given response even met the intent behind it.
AIOps shifts the focus from system health to how each request is executed. To make that work, you need a control layer that sits between your application and the models; one place where routing, policies, and visibility come together.
Why traditional MLOps falls short
Most platform teams start with the monitoring they already have: infrastructure metrics, API logs, latency dashboards. These are necessary but not sufficient. Here's where they break down.
Visibility gaps
Infrastructure metrics measure whether the system is running. They don't measure whether it's doing the right thing. A request that returns HTTP 200 with a hallucinated response looks identical to a correct one in your logs.
The signals that actually matter for LLM behavior — prompt quality, output relevance, model decision paths — are either absent from standard observability tooling or fragmented across provider dashboards with no shared context.
No request-level traceability
In a multi-step LLM workflow, a single user request can trigger multiple model calls, tool invocations, and validation steps across services. Traditional observability collects signals at each layer independently, but there's no unified trace connecting them.
When something goes wrong, you have isolated error events with no way to reconstruct the full execution path. Debugging becomes manual correlation across systems which becomes hard to reproduce.
LLM failures are different
Latency thresholds and error rate alerts are designed to catch infrastructure problems. LLM failures are different: incorrect outputs, degraded relevance, and cost drift don't move these metrics. Fallback chains can activate repeatedly due to poor response quality and the system will still appear healthy by every standard alert condition.
Costs are unpredictable
In most setups, token usage and cost are tracked retroactively through provider billing dashboards. There's no mechanism to enforce limits at the request or workflow level during execution. A single misconfigured workflow can silently consume a disproportionate share of your budget before anyone notices.
How AIOps solves these problems
Each of the failures above has the same root cause: there is no single operational layer that governs how requests are executed. AIOps introduces that layer. Here is what it enables.
End-to-end request traceability
With AIOps, every request carries a unified trace through its full execution path. You can see which prompt version ran, which model handled the request, how routing decisions were applied, what the output was, and where any failure occurred. Every step is connected under a single execution context.
This means debugging an LLM failure stops being manual log correlation. You follow the trace the same way you would in any other distributed system. OpenTelemetry provides the standardization layer that makes this possible, structuring logs, metrics, and traces consistently so signals across infrastructure and LLM-specific layers can be correlated rather than analyzed in isolation.
Routing and policy enforcement at runtime
AIOps gives you the ability to define and enforce routing behavior explicitly, rather than letting it happen implicitly across individual services. You set conditions: which model handles which request, when fallbacks activate, how retries behave, what content policies apply before responses reach users.
When something changes, such as a model degrading, a provider going down, or a cost threshold being hit, the system responds according to defined rules. Routing behavior becomes something you govern, not something you observe after the fact.
Usage control during execution, not after
AIOps shifts cost from a trailing metric to a governable variable. Instead of reviewing spend after the billing cycle closes, you can enforce constraints during execution:
- Token limits per workflow, team, or API key
- Rate limits on specific models or endpoints
- Requests that exceed defined thresholds are throttled or blocked
- Usage attributed to specific workflows or owners in real time
This means teams can enforce budgets, prevent runaway usage, and align model consumption with operational constraints without waiting for a billing surprise.
Governance and auditability
As LLM systems scale across teams, AIOps gives you the ability to define and enforce who can call which models, under what conditions, and with what constraints. Access control operates at the model, provider, and API key level.
Every request is logged with its associated prompt, model, routing decision, and output. This creates a traceable record that supports debugging, compliance validation, and root cause analysis at the request level. Governance stops being documentation and becomes something enforceable.
What this looks like in practice
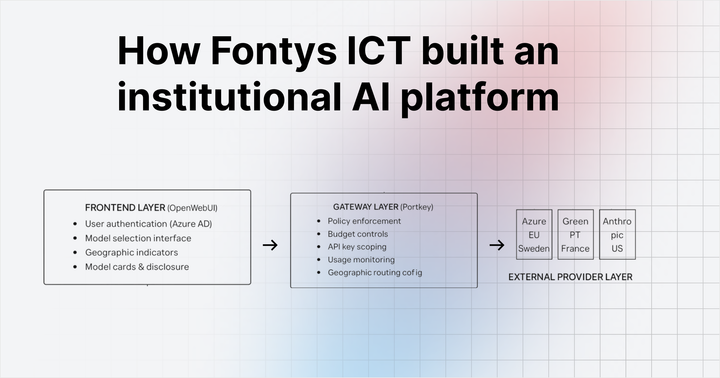
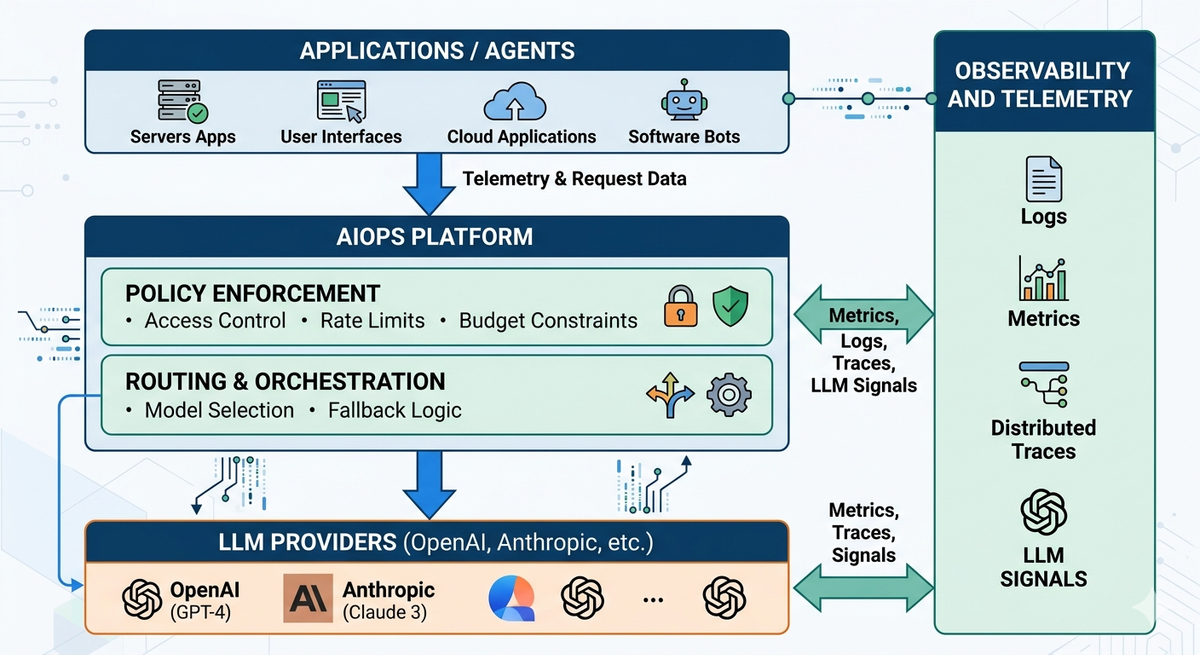
The architecture that delivers AIOps for LLM systems is an operational layer that intercepts every request between your application and your model providers. At each step, AIOps evaluates routing policy, enforces access controls and usage limits, validates responses, and logs the full execution context.
Platforms like Portkey's AI Gateway implement this pattern, providing centralized routing, policy enforcement, and observability across all model interactions from a single interface.
Teams that adopt this approach typically see the same outcomes: faster debugging because traces are complete, more predictable costs because limits are enforced at runtime, and more consistent model behavior because routing is governed by policy rather than scattered across services.
FAQs
What problems does AIOps solve for LLM systems?
AIOps addresses the visibility and control gaps that standard infrastructure monitoring cannot cover: output drift, cost spikes without obvious triggers, failed requests with no traceable root cause, and policy enforcement across teams and workflows. It shifts the focus from whether requests are completing to how they are executing.
How is AIOps different from monitoring?
Monitoring tells you whether your system is running. AIOps tells you how it is behaving and gives you controls to change that behavior. The distinction matters most when a system appears healthy by every infrastructure metric but is producing incorrect, expensive, or inconsistent outputs.
Where should teams start?
Pick one workflow with limited visibility and focus on tracing requests end-to-end across prompts, model selection, token usage, and execution path. Once you have that baseline, introduce controls such as routing rules and usage limits before expanding to other workflows.
What skills are needed to implement AIOps for LLM systems?
Teams need familiarity with prompts and model behavior, basic observability concepts (logs, metrics, traces), and enough system design knowledge to introduce an operational layer between applications and models. Deep ML expertise is not required. This is fundamentally a platform engineering problem.
How do teams measure ROI?
The clearest signals are reduced time to root cause when something breaks, fewer unexpected cost increases, and fewer incidents caused by uncontrolled model behavior. Teams also report spending less time on manual log correlation and more time building, which is harder to quantify but consistently cited.