How LLM tracing helps you debug and optimize GenAI apps
Learn how LLM tracing helps you debug and optimize AI workflows, and discover best practices to implement it effectively using tools like Portkey.
AI systems built with large language models now handle multi-step reasoning, chain complex tools together, and integrate with dozens of APIs. This jump in complexity creates a big challenge: when something goes wrong, how do you figure out what happened? That’s where LLM tracing comes in.
This post explains what LLM tracing is and why it's becoming essential.
What is LLM tracing?
LLM tracing is the structured logging of every step in a generative AI workflow. It captures the execution path from input to output, including all intermediate steps—retrievals, model calls, tool usage, and post-processing.
Each step is recorded as a span, with metadata like latency, inputs, outputs, token usage, and model parameters. These spans are linked to form a full trace, giving you a complete picture of how a request was processed.
Unlike generic logs or monitoring, tracing shows exactly what happened, in what order, and how long each step took. This is especially critical when dealing with agents, RAG pipelines, or custom toolchains that introduce multiple execution paths.
With LLM tracing, you can pinpoint failures, optimize performance, track costs, and audit behavior—without guessing.
Why tracing matters for GenAI workflows
Modern GenAI has pipelines made of prompts, models, tools, APIs, and conditionals. Without visibility into these components, you're debugging in the dark.
Here’s why tracing is critical:
- Debug broken chains: When a pipeline fails—whether due to a bad prompt, missing context, or a tool error—tracing helps you locate the exact failure point. You can inspect inputs and outputs for each span to understand what went wrong.
- Optimize latency: Tracing the surface bottlenecks in your execution graph. You can see how long each step takes—from retrieval latency to model response time—and tune accordingly.
- Track token usage and cost: Token counts and model usage are logged at each step. This makes it easy to trace high-cost queries back to specific spans and optimize or cache them.
- Understand behavior in production: With tracing, you get a real-time view of how prompts behave across users, what models are being hit, and how different workflows are triggered.
- Audit and monitor complex flows: Especially in agent-based or multi-hop pipelines, tracing lets you see every tool call, decision node, and fallback—critical for debugging and observability at scale.
LLM tracing is the foundation for building reliable, scalable GenAI systems.
How Portkey enables end-to-end LLM tracing
Portkey is built to give developers full visibility into every LLM call and its context, without having to modify your application logic.
Here’s how it works:
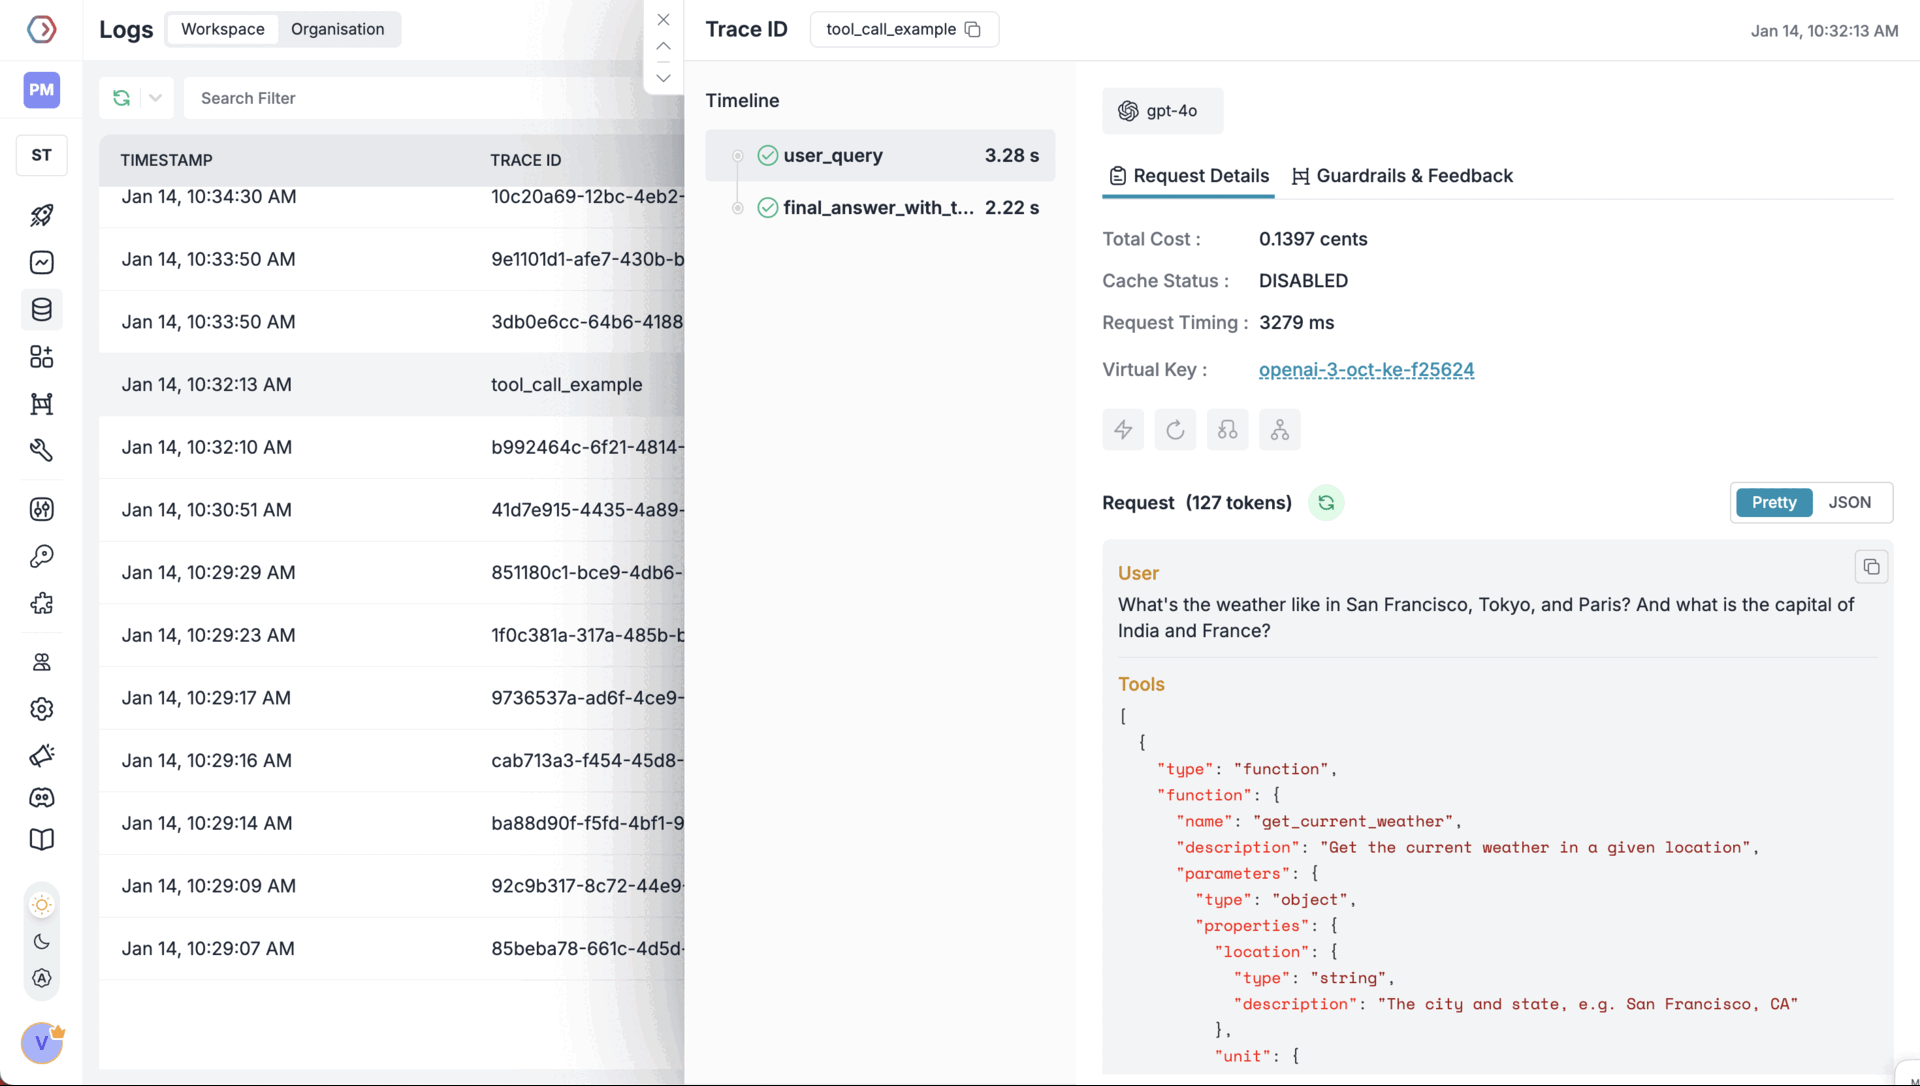
- Detailed metadata capture: Each span logs inputs, outputs, model name, temperature, token usage, latency, and status. You can also attach custom tags (e.g. user ID, experiment group) for filtering and analytics.

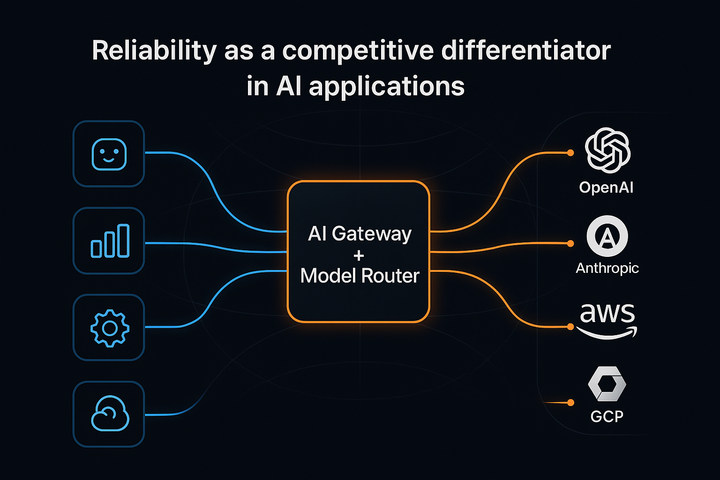
- Cross-model and provider support: Whether you're using OpenAI, Anthropic, Mistral, or any custom model, Portkey unifies tracing across providers and abstracts away implementation details.
- Visual traces: Portkey provides a UI to inspect traces in real-time. You can drill down into each step, compare traces over time, and export data for analysis.
- Tracing external calls: Tool or API calls used within agents or workflows can be traced as part of the same span tree, giving you a full picture of the interaction chain, not just the LLM parts.
- Minimal setup: You don’t have to rebuild your app. Portkey works as a gateway or a lightweight SDK, so you get full tracing coverage without restructuring your codebase.
If you want to understand how your GenAI system behaves, where it’s failing, and how to improve it, Portkey gives you that view instantly.
Best practices for LLM tracing
To maximize the effectiveness of LLM tracing and observability, follow these best practices:
- Establish key performance indicators (KPIs) that align with your objectives, such as response quality, latency, model efficiency, and cost per query. These metrics will guide your trace analysis and optimization efforts.
- Ensure detailed logs are captured for all LLM interactions. This should include inputs (prompts), raw outputs, metadata, and post-processing steps. The more detailed the logs, the easier it is to trace issues back to specific points in your workflow.
- Use dashboards and alerting systems to track critical metrics like latency, token usage, and success/failure rates.
- Periodically review your LLM application’s performance and health. This includes checking for performance bottlenecks, security vulnerabilities, and compliance with best practices or regulations.
- Create systems for continuous feedback based on observability data. This ensures that your system is always improving based on performance trends, user behavior, and operational metrics.
- Use the insights gathered from your tracing data to make informed decisions on how to improve prompts, model selection, and overall system architecture. Use the data to guide targeted optimizations and fine-tuning.
Adding LLM tracing to your AI apps
Getting LLM tracing working in your applications doesn't have to be complicated. Instead of building a custom tracing system, which can take weeks of engineering time, consider using a purpose-built solution like Portkey. These are designed to plug into your existing AI stack and start capturing useful data right away.
Look for solutions that can wrap your existing model providers and capture data automatically. This makes it much easier to add tracing to systems that are already in production. Many teams start with simple logging and then realize they need more detailed insights. True LLM tracing goes beyond basic logs by connecting related events into coherent traces that show the full journey of a request through your system.
Implementing proper tracing will help you spot patterns, identify bottlenecks, and make informed decisions about how to improve your AI applications.
If you’d like to get started with Portkey, book your demo today.