
End-to-End Debugging: Tracing Failures from the LLM Call to the User Experience
Learn how Portkey and Feedback Intelligence combine to deliver end-to-end debugging for LLMs,tracing infrastructure health and user outcomes together to find root causes faster and build reliable AI at scale.
Building with LLMs has now reached a stage where it is about delivering outcomes rather than just text, that are fast, accurate, and genuinely useful to users. But as teams move from prototypes to production systems, they discover that failures can occur at multiple layers of the stack, often without clear visibility into where things are breaking down.
- Infrastructure issues like timeouts, routing errors, or sudden cost spikes can derail performance.
- Prompt and model issues lead to hallucinations, irrelevant answers, or repetitive responses.
- User experience issues show up when users feel confused, rephrase their requests, or abandon the interaction altogether.
Each of these problems looks similar on the surface — “the AI failed” — but the root causes live in very different places. Without connecting signals across infra, model, and user experience, teams end up spending hours chasing dead ends. Debugging becomes guesswork instead of a systematic process.
That’s where end-to-end debugging comes in: tying together what happened at the request level with how the user experienced it. Done right, it shortens the feedback loop from failure to fix, and helps teams build AI systems that are not just functional, but dependable at scale.
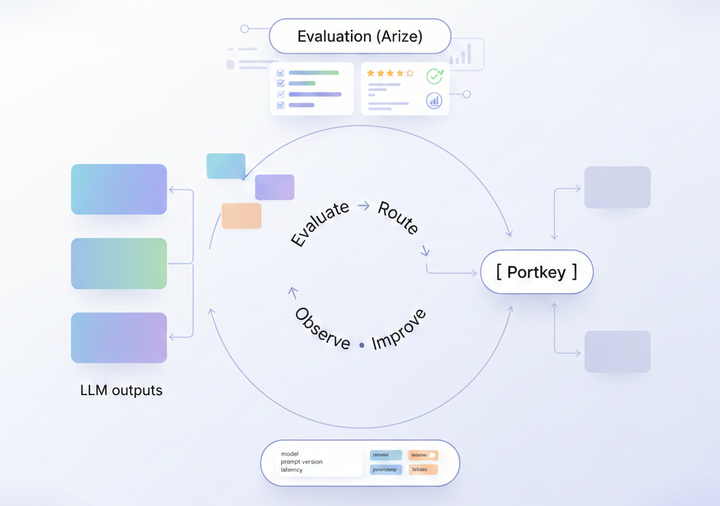
Portkey: Full Trace of Requests Across Models and Tools
When debugging AI systems, the first step is to understand what happened at the infrastructure layer. Was the request slow, expensive, or dropped altogether? Did the gateway route it correctly, or did it fail at the provider side?
Portkey gives teams this visibility with end-to-end request traces across 250+ models and providers. Every request flowing through the gateway is automatically instrumented, so developers don’t have to stitch together logs from different SDKs or cloud services.

With Portkey, each trace captures key details:
- Latency and throughput — how long each request took, and where time was spent.
- Token usage and cost — full visibility into consumption and spend.
- Routing and caching behavior — which provider handled the call, whether it was served from cache, and what fallbacks were triggered.
- Errors and timeouts — broken down by provider, so teams can isolate external issues quickly.
For example, a developer investigating a latency spike can open the Portkey dashboard and immediately see that responses from a specific provider slowed down after a certain time. Instead of guessing, they now know it’s a provider-side issue, not their code or prompt.
This goes beyond single LLM calls. Portkey can also trace entire agent runs where an LLM is orchestrating multiple steps across APIs, tools, and other models. Instead of seeing just the final output, teams can follow the full chain of reasoning and execution: which tool was invoked, how long it took, whether retries happened, and where bottlenecks emerged.

Feedback Intelligence: Full Trace of User Experience and Interaction Quality
Observability focused on user-facing outcomes.
Even when system metrics report all green, the user experience can still fail. The pipeline may execute flawlessly, yet the interaction breaks down. This is where the focus shifts from infrastructure observability to user-facing outcomes, capturing intent alignment, response quality, and satisfaction signals directly from interactions to understand why users leave confused or dissatisfied. That way, you’re not waiting for a thumbs-up/down, you’re getting rich insights into what’s really happening and can act on it instantly.
Proprietary lightweight LLMs orchestrated to evaluate conversations across specific dimensions:
Each interaction is evaluated by Feedback Intelligence’s orchestration layer, which combines specialized small LLMs, ML/NLP techniques, and domain-specific logic for real-time conversational diagnostics. This multi-component approach not only ensures evaluations are context-aware and highly adaptable to different use cases but also generates use-case-specific reports so teams can track the metrics that matter most:
- E-commerce → resolution rate and task completion are critical.
- Fintech → correctness, compliance, and factual precision dominate.
- Mental health → empathy, tone, and user sentiment take priority.
All evaluators and reports are highly customizable, allowing teams to define the exact outcomes they care about, from business KPIs to conversational quality metrics, and measure them systematically.

Some of the evaluation dimensions are below
- User confusion or retries flagged - Detects when users rephrase, repeat, or escalate requests, using turn-level patterns and interaction loops to flag friction points or unclear responses
- Misalignment (hallucinations, unhelpful responses) detected - identifies when the model output is off-topic, factually incorrect, or unhelpful, leveraging FI’s evaluators for hallucination risk, coherence, and task relevance.
- Intent vs. response match, satisfaction signals, sentiment - Scores how well the response aligns with the original user intent and infers satisfaction or frustration from sentiment, dwell time, re-engagement, and drop-off patterns.
Together, these signals build a structured view of the interaction and reveal problems that remain invisible in system logs.
Example: a chatbot conversation where the user repeats the same request multiple times.
For example, a product manager reviewing this dashboard can immediately see that most chats are rated “Very Satisfied,” but over 130 are marked “Very Unsatisfied.” Instead of guessing why users left frustrated, they now know which conversations to investigate and can act on concrete interaction-level insights, not just system metrics

Better together
On their own, infrastructure traces or user feedback only tell part of the story. Portkey shows whether the system performed as expected at the request or agent level. Feedback Intelligence shows whether the user actually got what they needed. When you connect the two, you can debug problems with far more precision.
Here’s how the combined view plays out:
- Infra view (Portkey): Was the request slow, routed incorrectly, or did the provider fail?
- Experience view (Feedback Intelligence): Did the user express confusion, repeat their request, or show signs of dissatisfaction?
By overlaying these perspectives, teams can isolate issues quickly:
- If infra is clean but users are retrying → the problem is with prompting or model quality.
- If infra latency spikes and users churn → it’s an infrastructure bottleneck.
- If both infra and routing are fine but users still fail → it’s likely an alignment or training gap.
Instead of guessing where failures originate, teams can move straight to fixing them whether that means switching providers, tuning prompts, or refining the model itself.
The result is a much faster path from failure → diagnosis → resolution, and more reliable AI agents in production.

Towards reliable AI at scale
Reliability in AI is all about whether they system runs well and delivers meaningful outcomes to users.
Portkey ensures performance reliability. It provides the infrastructure visibility: latency, costs, routing, and full traces of requests and agent runs.
Feedback Intelligence ensures experience reliability. It interprets what the logs can’t: whether users felt satisfied, confused, or compelled to retry.
By combining these two layers, teams get a complete debugging loop. Infrastructure health and user alignment are no longer separate silos, but part of the same feedback system. The result is faster iteration, fewer wasted cycles, lower costs, and AI experiences that end users can trust.
As AI becomes central to workflows, this kind of end-to-end debugging isn’t optional — it’s the foundation for building production systems at scale.
👉 Ready to see this in action?
Explore Portkey to unify your LLM infrastructure, tracing, and governance.
Try Feedback Intelligence to turn user interactions into actionable insights for your AI.
Here’s a quick reference for diagnosing AI agent failures, mapping infra metrics and user experience observability to Portkey or Feedback Intelligence
| Infra Status | User Outcome | Tool to Investigate | Likely Root Cause |
|---|---|---|---|
| Errors / Latency High | Users churn or drop off | Portkey | Infra bottleneck |
| Clean Infra | Users retry / show confusion | Feedback Intelligence | Prompting or model quality issue |
| Clean Infra | Low intent alignment / satisfaction | Feedback Intelligence | Model alignment / knowledge gap |
| Errors / Latency High | No retries, instant drop-off | Portkey | Performance drove abandonment |
| Clean Infra | Task resolved, high satisfaction | Both (monitor only) | System working as intended |