What is autoinstrumentation?
Your AI agent works in staging. In production, something starts breaking. Responses are slower than expected, and token usage spikes. And occasionally, the agent takes a path no one expected. Infrastructure metrics look normal, but users are still reporting issues.
Traditional monitoring tells you whether servers are running, but it does not tell you what the model actually did, which prompt triggered a failure, or why an agent made a specific decision.
This is the observability gap in AI agent systems. Autoinstrumentation exists to close that gap by automatically capturing telemetry from every model call and agent workflow without requiring developers to add logging and tracing code manually.
What is autoinstrumentation?
Autoinstrumentation is the automatic capture of telemetry data from your application without requiring developers to add custom monitoring code. It runs at the SDK, agent framework, or gateway layer. From there, it automatically captures prompts, responses, token usage, latency, and tool calls for every model request.
In most backend systems, this usually means capturing HTTP request data, database query performance, and error rates. For LLM and AI agent systems, autoinstrumentation captures model-specific telemetry such as:
- Prompts sent to the model
- Responses returned
- Token counts
- Latency per request
- Tool calls
- Retry attempts
In production, the main advantage is consistency. Developers do not need to remember to add monitoring code to every new feature, and observability does not depend on how each team instruments their services. Telemetry is captured in a standardized way across services and environments, which makes debugging, cost tracking, and performance analysis much easier once systems start scaling.
Autoinstrumentation can operate at different layers of your stack. It can run at the:
- SDK layer, where the client library emits telemetry automatically
- Agent framework layer, where multi-step workflows and tool calls are traced
- Gateway layer, where all LLM traffic passes through a central gateway and telemetry is captured for every request, regardless of which model or provider you use
How autoinstrumentation works in LLM systems
In LLM systems, autoinstrumentation captures telemetry across the entire lifecycle of a model interaction. Every time your application makes a call to a model, autoinstrumentation can automatically record the exact prompt sent, the response that was returned, token usage, and latency. It does this without requiring you to wrap each call in custom logging functions or manually extract response metadata.
For AI agents that make multiple model calls in sequence, autoinstrumentation traces the entire workflow. A single user request might trigger a routing decision, a retrieval step, a reasoning call, a tool invocation, and a final response generation. Without tracing, these appear as separate events. With autoinstrumentation, they are linked into a single trace that shows the full workflow from start to finish.
This is how teams answer production questions such as what caused a latency spike, which prompt caused a failure, why an agent chose a specific tool, or why token usage suddenly increased. Without telemetry at this level, debugging LLM systems often turns into guesswork.
Beyond request and response logging, autoinstrumentation also captures contextual metadata that matters in production. This includes model versions, provider routing decisions, parameter settings such as temperature, and policy events such as guardrail blocks or fallback routing. When something fails, the full context of the failure is already captured.
When teams should use autoinstrumentation
Autoinstrumentation becomes vital when teams move beyond prototypes and into production systems:
- If you are using multiple LLM providers or models, autoinstrumentation gives you unified visibility across all of them
- If you are building AI agents with multi-step workflows, autoinstrumentation traces the entire chain of events, not just individual model calls
- If you are running in production, autoinstrumentation gives you the real-time visibility needed to detect issues before users report them
Cost tracking is another trigger point. Without autoinstrumentation, it is difficult to attribute token usage to specific teams, features, or user sessions. When multiple teams are building AI features, autoinstrumentation provides centralized observability so you are not managing separate dashboards and logging setups for each team.
And when you need to debug failures, autoinstrumentation gives you the structured data required to answer questions like what prompt caused the error or why the agent took the wrong path.
Autoinstrumentation with Portkey
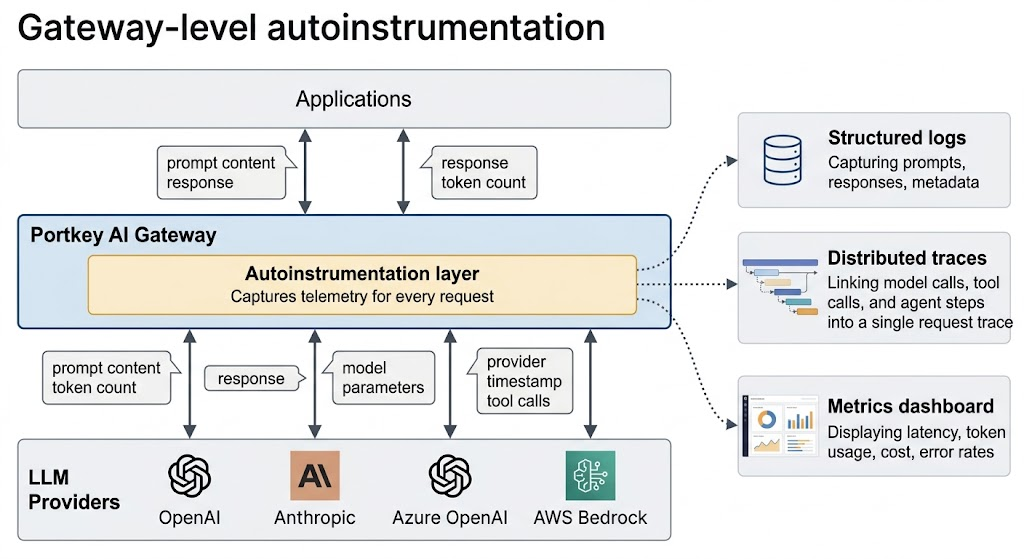
Portkey's AI Gateway implements autoinstrumentation at the infrastructure layer, capturing telemetry at every LLM request that passes through it without requiring changes to your application code. This includes prompts, responses, token usage, latency, model parameters, and provider information.
Because all LLM traffic passes through the gateway, telemetry is captured in a consistent format across providers, models, and applications, without requiring separate instrumentation for each provider.
The gateway also traces multi-step AI agent workflows by linking model calls, tool invocations, and routing decisions into a single request trace. It records policy events such as guardrail blocks and fallback routing, which makes agent behavior and routing issues easier to debug.
This centralizes observability into a single system where requests can be searched and analyzed by prompt, response, token usage, latency, or provider.

Get started with autoinstrumentation
Teams usually adopt autoinstrumentation once LLM systems move into production and manual logging is no longer reliable. At that stage, observability needs to be built into the system architecture rather than added to individual model calls.
To see how autoinstrumentation is implemented in practice, explore Portkey's documentation. You can also request a personalized demo to see how gateway-level autoinstrumentation works for AI agents.
FAQs
What is autoinstrumentation in observability?
Autoinstrumentation automatically captures telemetry data such as logs, traces, and metrics from an application without requiring developers to write custom monitoring code. It hooks into your existing application stack or infrastructure layer to collect this data consistently.
How is autoinstrumentation different from manual instrumentation?
Manual instrumentation requires developers to add logging and tracing code to every function, API call, or service they want to monitor. Autoinstrumentation captures telemetry automatically, which reduces developer effort and ensures consistent observability across services.
Does autoinstrumentation work for LLM applications?
Yes. Autoinstrumentation for LLM systems captures model-specific telemetry, including prompts, responses, token usage, latency per request, tool invocations, and agent workflow traces. This provides visibility into how models and agents behave in production.
Do I need to change my code to use autoinstrumentation?
It depends on the implementation. SDK-level autoinstrumentation may require adding a library, while gateway-level autoinstrumentation requires routing LLM traffic through a gateway but does not require changes to application logic.