What is LLM Observability?
Discover the essentials of LLM observability, including metrics, event tracking, logs, and tracing. Learn how tools like Portkey can enhance performance monitoring, debugging, and optimization to keep your AI models running efficiently and effectively
The growing adoption of large language models brings new challenges in tracking and understanding their behavior. It’s about having the tools and processes to monitor how LLMs perform, both during training and in production. Unlike traditional software systems where metrics like CPU usage or memory consumption are enough, LLM observability dives deeper into the intricate details of how models process inputs, generate outputs, and evolve.
LLM observability isn’t just about tracking failures—it’s about understanding a model's full lifecycle. This includes monitoring the input data, analyzing the outputs, and detecting anomalies that could signal underlying issues.
Moreover, LLM observability is an ongoing practice. It goes beyond initial deployment, ensuring continuous feedback loops are in place to improve the model's alignment with user expectations, business goals, and ethical standards.
LLM Monitoring vs LLM Observability
While both monitoring and observability are necessary for keeping LLMs functioning smoothly, they serve distinct roles.
Monitoring typically tracks system-level metrics, such as uptime, error rates, and response times. It’s a passive, reactive approach—teams are alerted when something goes wrong, but the scope of monitoring is limited to surface-level issues. Monitoring tools provide the “what”—what’s happening with the system at any moment.
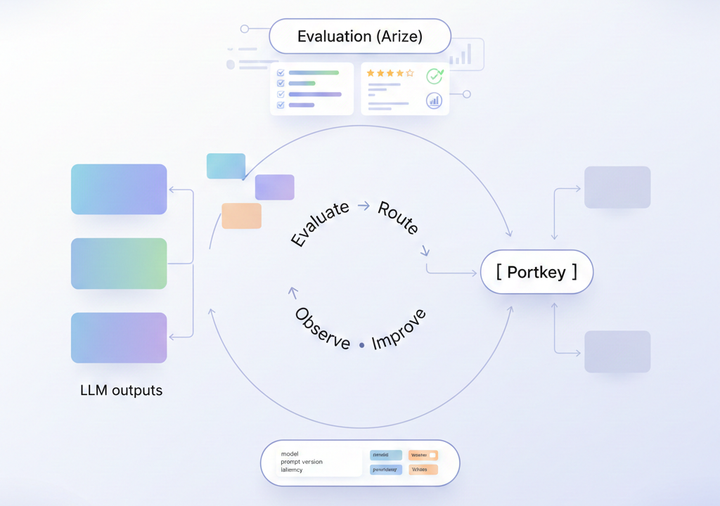
LLM observability, however, is much deeper. It’s about understanding the underlying why and how of model behavior. While monitoring tells you something is wrong, observability gives you the context needed to troubleshoot and resolve those issues. It includes tracking inputs, outputs, and intermediate steps, enabling teams to identify trends, uncover anomalies, and pinpoint performance bottlenecks or biases. Observability also supports proactive optimization, providing teams with insights that help prevent issues before they arise, rather than merely reacting to failures.
Pillars of LLM Observability
Effective LLM observability relies on several key pillars that help monitor and improve model performance. These pillars provide a structured approach to tracking model behavior and ensuring its alignment with business goals.
LLM observability relies on four key data types, often referred to as MELT: Metrics, Events, Logs, and Traces. These provide a comprehensive framework for monitoring, analyzing, and improving the performance of large language models.
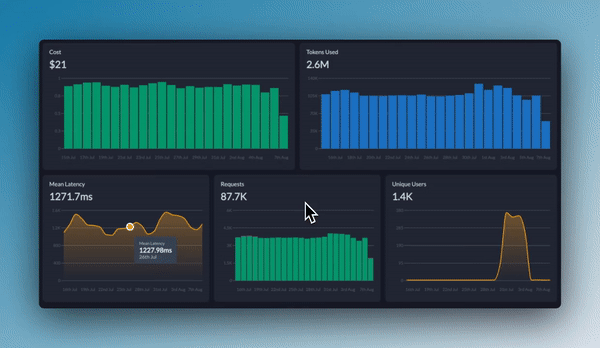
Metrics: These are quantitative measurements that capture the performance of the model, such as response time, resource utilization, accuracy, and error rates. Metrics allow teams to assess overall health, track efficiency, and set thresholds for performance expectations. Common examples include token usage, latency, and throughput, which help in identifying operational bottlenecks or inefficiencies in the model’s behavior.

Events: Events represent specific occurrences that affect the system or model, such as updates, retraining sessions, deployment changes, or model configuration adjustments. Events provide valuable context by linking the "what" to the "why," helping teams understand how certain actions or decisions influence model performance. For instance, if there’s a spike in error rates following a model update, the corresponding event can help pinpoint the cause of the issue.
Logs: Logs are detailed records of the model’s activities, tracking inputs, outputs, processing steps, and errors. They play a critical role in diagnosing problems and understanding model behavior over time. Logs help capture granular data, such as specific queries that led to incorrect or biased responses, enabling teams to identify issues at a micro level and trace them back to potential sources of error.
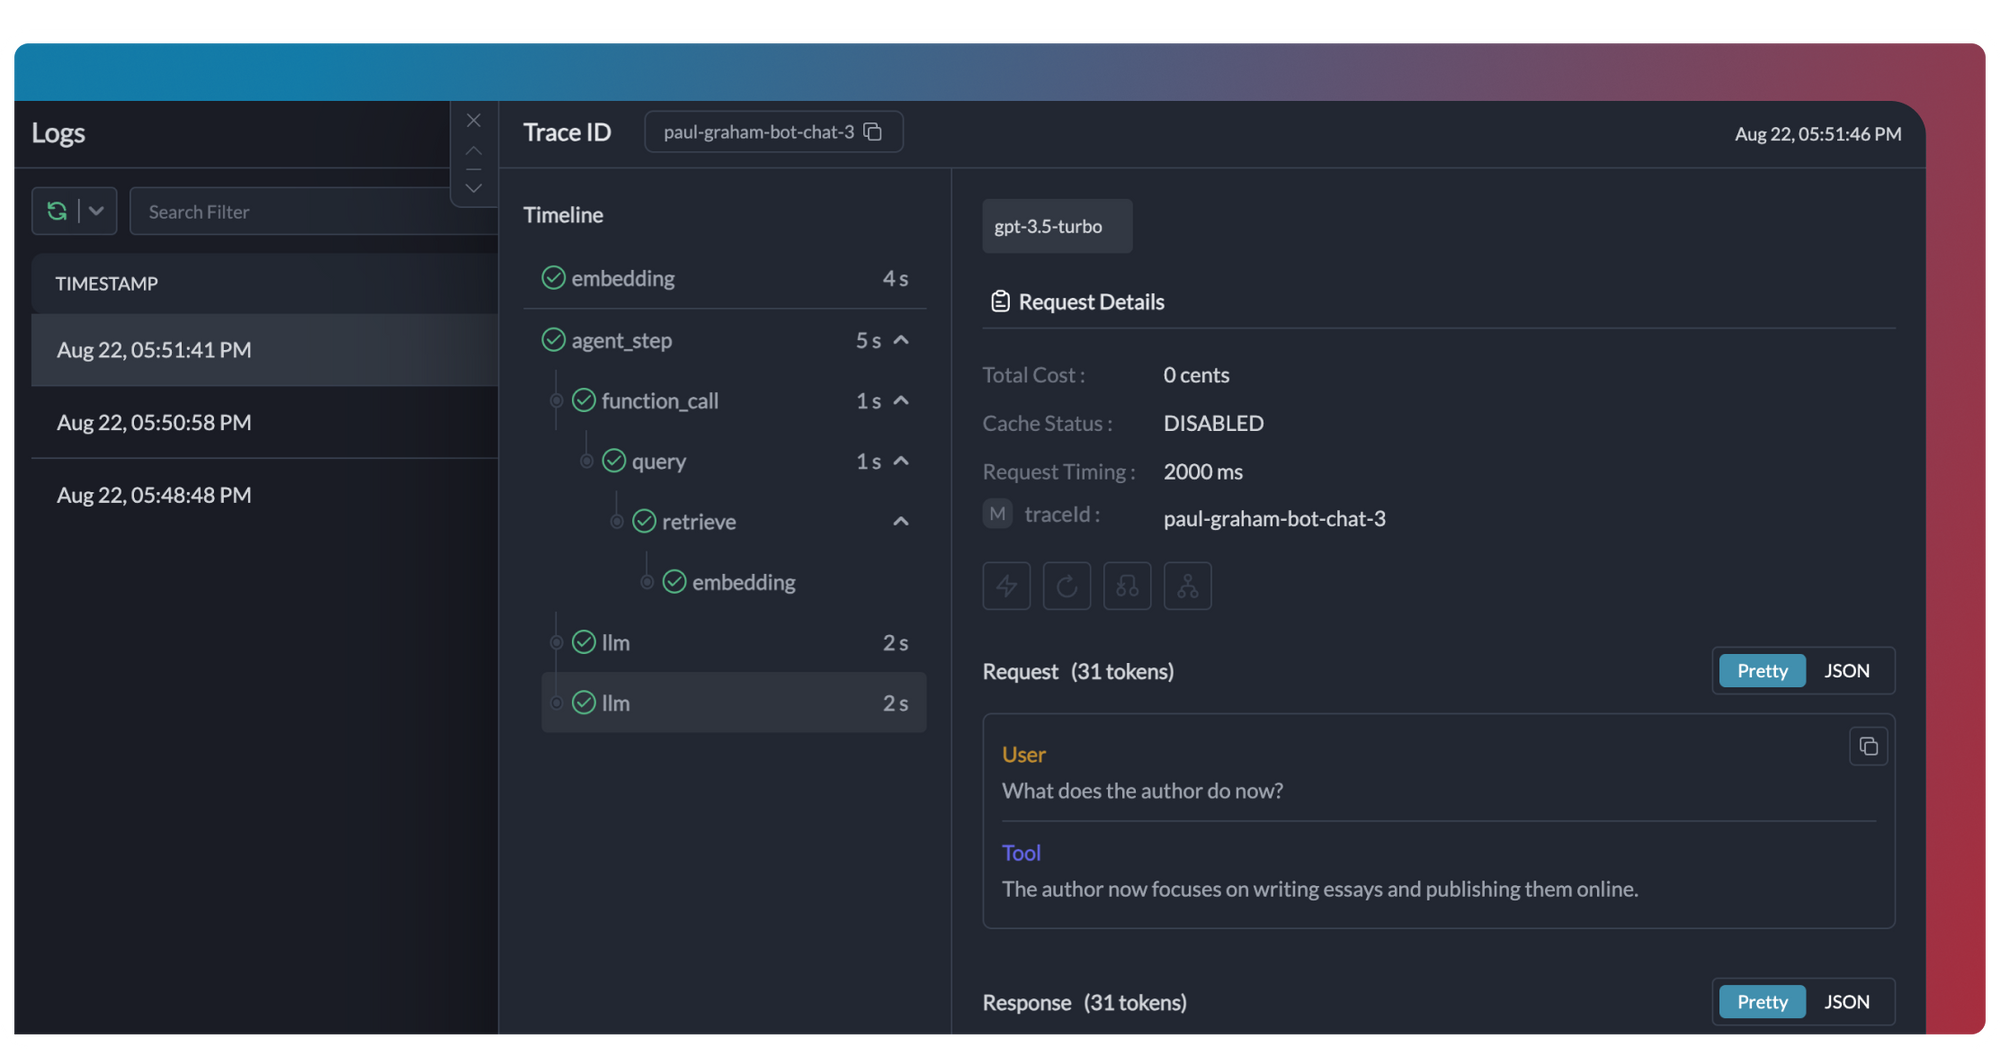
Traces: Traces provide a timeline of data flow through the system, showing how requests are processed through various model components. Tracing helps uncover performance bottlenecks and identify inefficiencies in the model pipeline, especially in complex systems where multiple processes interact. Traces allow for deep visibility into individual request lifecycles, helping to pinpoint where delays or errors occur and how they impact the overall performance.
Together, these pillars offer a unified view of model health and performance, enabling teams to take proactive steps to optimize, troubleshoot, and enhance the effectiveness of large language models.
LLM Observability Tools
Portkey provides an integrated LLM observability platform designed to optimize performance and ensure operational excellence. Through its powerful observability tools, teams can track metrics, examine logs and trace data flows in real time, offering a full-spectrum view of model behavior.
Real-Time Metrics: Portkey collects and visualizes important performance metrics like latency, token usage, and accuracy. With these metrics, teams can identify inefficiencies, track usage patterns, and quickly detect performance issues, ensuring the model operates within set thresholds.
Centralized Logs: Portkey’s logging feature captures detailed data on every interaction with the model—inputs, outputs, and errors. This is invaluable for debugging and improving model behavior. Logs allow teams to trace issues to specific interactions, identify sources of failure, and refine the model’s processes.
Tracing: With OpenTelemetry-compliant tracing, Portkey tracks requests as they flow through each layer of the model pipeline. This provides insight into where delays or errors may occur, enabling teams to pinpoint inefficiencies or bottlenecks and optimize the model for better performance.

LLM observability is crucial for ensuring that large language models deliver optimal performance, maintain efficiency, and align with business objectives. By tracking key metrics, capturing events, logging detailed data, and tracing requests, teams can gain actionable insights that enable proactive optimization and troubleshooting.
With Portkey’s LLM observability platform, which seamlessly integrates these observability pillars into one platform, AI teams can continuously improve their models, mitigate risks, and drive better outcomes. Adopting a robust observability strategy is essential for staying ahead in the rapidly evolving AI landscape.


