
⭐ The Developer’s Guide to OpenTelemetry: A Real-Time Journey into Observability

In today’s fast-paced environment, managing a distributed microservices architecture requires constant vigilance to ensure systems perform reliably at scale. As your application handles thousands of requests every second, problems are bound to arise, with one slow service potentially creating a domino effect across your infrastructure. Finding the root cause can feel like searching for a needle in a haystack. That’s where OpenTelemetry becomes a valuable asset, as the industry-standard framework for observability in cloud-native systems.

What Exactly Is OpenTelemetry?
OpenTelemetry is a powerful, open-source toolkit for collecting, processing, and analyzing observability data—traces, metrics, and logs—from your distributed systems. It’s designed to provide visibility into system performance and help identify and troubleshoot issues across your entire architecture.
Let’s break down each observability component:
- Traces: Track requests as they move through your services, allowing you to pinpoint bottlenecks and identify where failures are occurring.
- Metrics: Quantitative measurements like response times, memory usage, and active user counts that provide an overall picture of system health.
- Logs: Event-level data offering detailed insights into failures or unexpected behavior, complementing metrics and traces for a comprehensive view of system health.
By combining these elements, OpenTelemetry provides a comprehensive view of your system’s behavior, making it easier to trace and resolve issues.
Why OpenTelemetry Matters
If you’re working with microservices or cloud-native applications, you understand the complexity that comes with managing individual services. Traditional monitoring tools often only provide insights at a service level, failing to offer a holistic view of the entire system. OpenTelemetry addresses this gap by providing a big-picture perspective, bringing together traces, metrics, and logs to help you understand how your system is working—not just if it’s working.
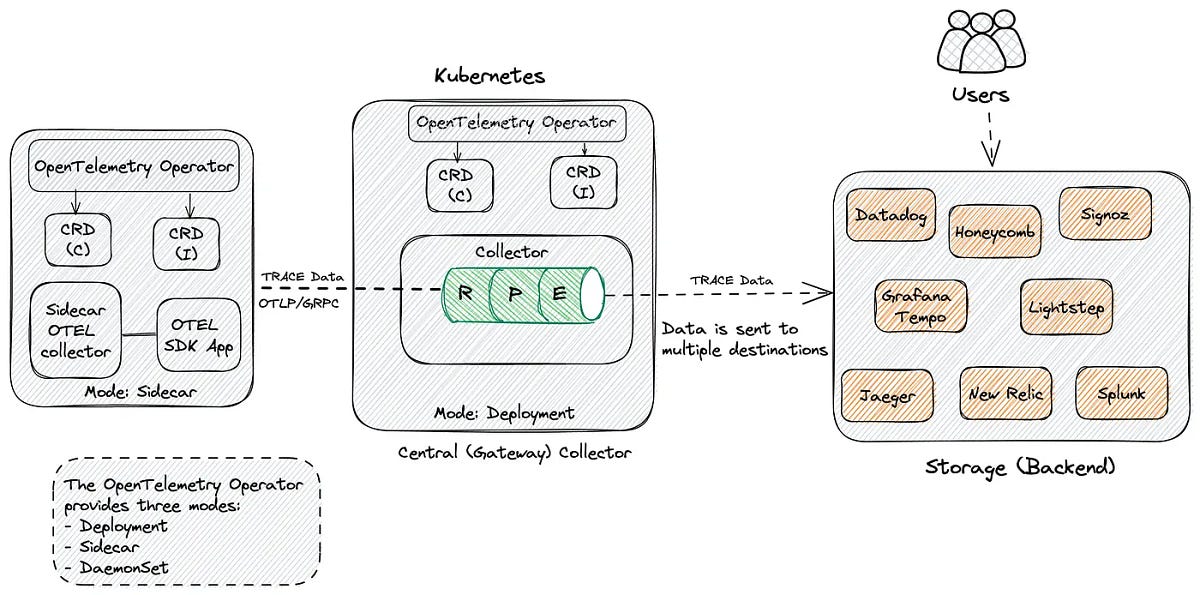
Another advantage of OpenTelemetry is its vendor-neutral architecture. This allows you to use a variety of backends, such as Prometheus for metrics, Jaeger for tracing, and Elasticsearch for logs. You can continue using the tools that work best for you while benefiting from unified, standardized telemetry data across your application stack.
OpenTelemetry in Action
Let’s explore how you can use OpenTelemetry in a real-world scenario. Imagine you’re running a microservices-based e-commerce platform. When a customer places an order, their request moves through services like user authentication, inventory checking, payment processing, and order fulfillment. If you notice a delay in processing these orders, you need to understand why.
With OpenTelemetry, you’d follow this process using distributed tracing:
- Start with the user authentication service, where the request is handled correctly.
- The trace then moves to the inventory checking service, where a delay is detected. Reviewing the metrics, you notice an increase in CPU usage for the underlying database.
- Logs provide further detail, showing a specific query causing the slowdown.
Thanks to OpenTelemetry, you’re able to identify and resolve the issue in minutes, rather than spending hours searching through individual logs or attempting to guess where the problem might be.
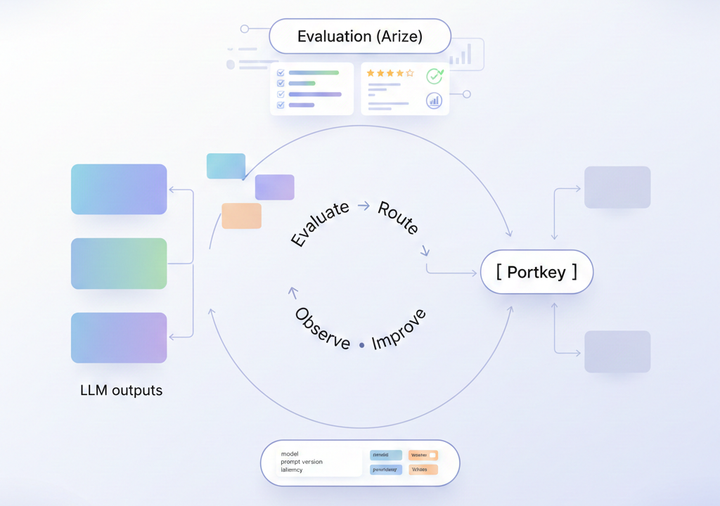
Portkey’s OpenTelemetry Integration
Portkey’s compliance with OpenTelemetry ensures it meets the certified standards for observability in distributed systems. By aligning with OpenTelemetry, Portkey integrates effortlessly with various tools and platforms, allowing users to collect, process, and analyze telemetry data from their applications. This approach ensures standardized, vendor-neutral monitoring and tracing across distributed systems, making it easier to manage and optimize complex environments.
Key features available on Portkey through OpenTelemetry integration include:
- Automatic instrumentation for capturing metrics, traces, and logs with minimal effort.
- Context propagation to seamlessly track requests across services.
- Comprehensive end-to-end tracing for full visibility into system performance.
- Backend-agnostic compatibility allows integration with various storage solutions for flexible telemetry data analysis.
With Portkey’s OpenTelemetry integration, users can mitigate common observability challenges by using efficient sampling techniques and simplifying data management with backend compatibility.
Explore Portkey’s observability suite for enhanced OpenTelemetry support

Common Challenges (and How to Avoid Them)
While OpenTelemetry provides a powerful observability framework, there are a few common pitfalls to watch out for:
- Over-Instrumentation: Instrumenting every part of your application can generate more data than you can handle. Focus on high-traffic paths and critical services to avoid overwhelming your system with unnecessary data.
- Not Using Sampling: Collecting traces for every single request can quickly overload your backend. Implement sampling to capture only the most relevant transactions, ensuring you get the insights you need without excessive data load.
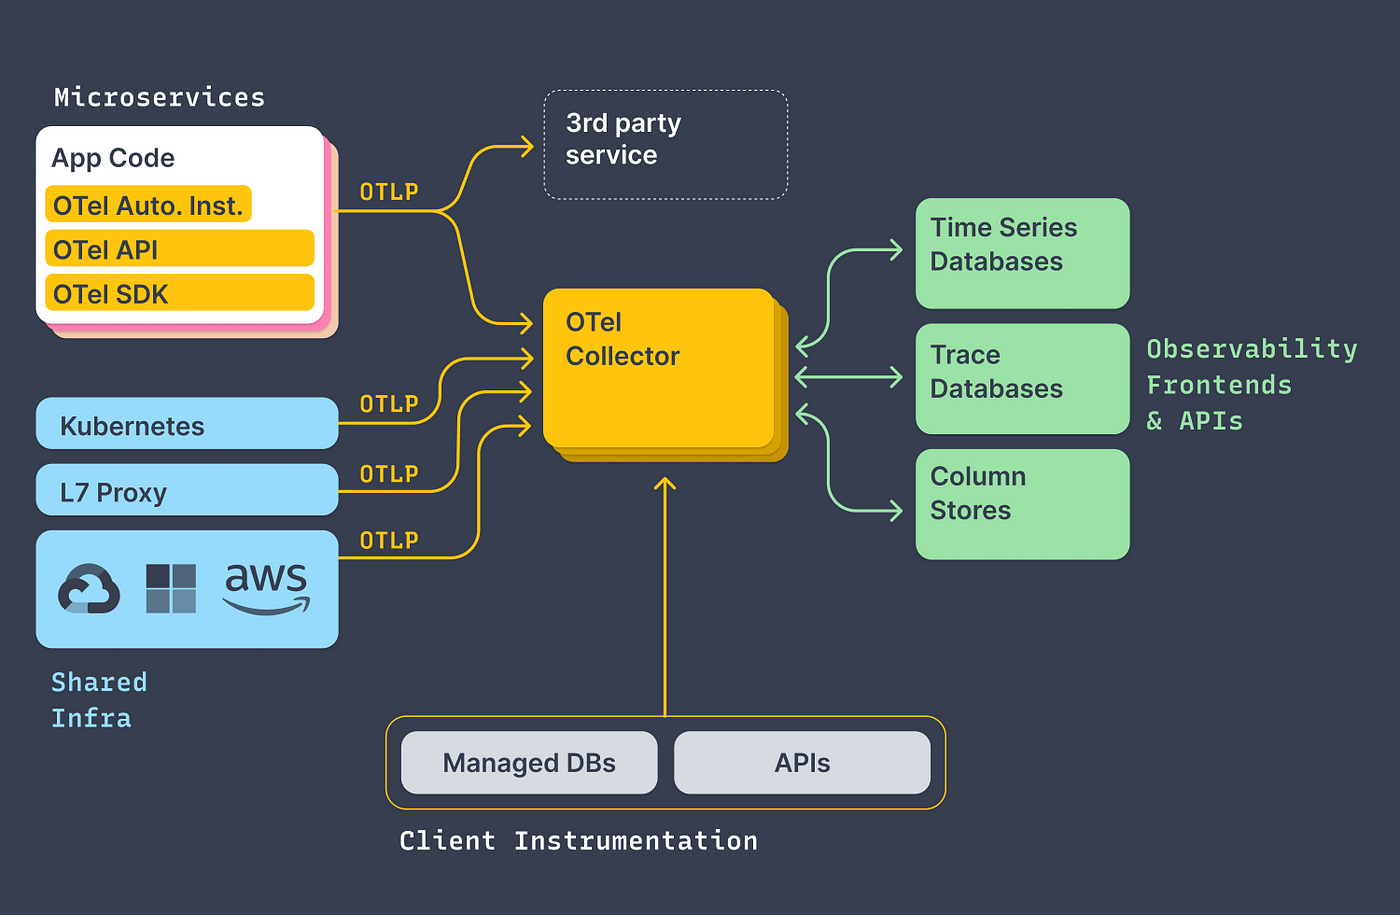
- Skipping the Collector: Some developers might bypass the OpenTelemetry Collector, thinking it’s optional. However, the Collector plays a crucial role in centralizing and managing your telemetry data. It simplifies scaling and exporting telemetry data and is lightweight and easy to deploy. If you're using Kubernetes, deploying the OpenTelemetry Helm Charts simplifies this process significantly.
OpenTelemetry vs. OpenTracing: What’s the Difference?
A common question when evaluating observability frameworks is: OpenTracing vs. OpenTelemetry—what’s the difference? OpenTracing was one of the first frameworks to offer distributed tracing, while OpenTelemetry expands on this by incorporating metrics and logs, making it a more comprehensive solution. OpenTelemetry is the next evolution, combining the best of OpenTracing and other observability tools to provide an all-in-one solution. Its growing support and expanded features make it a future-proof solution for developers looking to scale their observability efforts.
Why OpenTelemetry is Right for Your Distributed Systems
For developers working with distributed systems, OpenTelemetry offers the visibility you need to monitor, manage, and optimize performance. By providing a unified observability framework, OpenTelemetry helps teams troubleshoot issues faster, scale their applications more efficiently, and deliver a more reliable user experience.
Though OpenTelemetry is continually evolving, it already offers the robust tools needed to transform how you monitor and manage complex environments. As new features and expanded support become available, OpenTelemetry will only become more powerful.
Ready to Dive In?
There’s no better way to understand the power of OpenTelemetry than by trying it out. Start by instrumenting a simple service, and experience firsthand how OpenTelemetry and Portkey together provide valuable insights into your system’s performance. Visit Portkey docs to explore our OpenTelemetry-compliant features.Visit Portkey docs to explore our OpenTelemetry-compliant features.
Have you started using OpenTelemetry AWS or tried other cloud integrations? Let us know your experiences in the comments!
FAQ Section :
- What is OpenTelemetry?
- OpenTelemetry is an open-source observability framework that provides tools to collect, process, and analyze telemetry data from distributed systems.
- How does OpenTelemetry improve observability?
- By integrating traces, metrics, and logs, OpenTelemetry offers a unified view of system performance, making it easier to identify, troubleshoot, and resolve issues.
- How do I integrate OpenTelemetry with Portkey?
- Portkey’s OpenTelemetry integration allows seamless collection and analysis of telemetry data with vendor-neutral monitoring tools like Prometheus, Jaeger, and Elasticsearch.
- What’s the difference between OpenTelemetry and OpenTracing?
- OpenTelemetry is a more comprehensive solution than OpenTracing, as it includes metrics and logs in addition to distributed tracing.