LLM observability vs monitoring

Your team just launched a customer service AI that handles thousands of support tickets daily. Everything seems fine until you start getting reports that the AI occasionally provides customers with outdated policy information. The dashboard shows the model is running smoothly - good latency, no errors, high uptime - yet something's clearly off. This is where LLM observability vs monitoring becomes crucial.
Think of it this way: monitoring told you your AI system was technically healthy, but observability would have helped you understand why it was giving incorrect responses. It's the difference between knowing something's wrong and understanding why it's wrong.
In this post, we'll break down LLM observability vs monitoring - both play distinct but complementary roles in managing LLM applications. Whether you're dealing with hallucinations, performance drifts, or accuracy issues, you'll learn how these approaches can help you catch and fix problems before they impact your users.
What is LLM monitoring?
LLM Monitoring involves keeping a close watch on system health through predefined metrics and events. Reactive by nature, it is designed to detect issues like downtime, latency spikes, or excessive token usage. Monitoring answers questions like: Is the system up and running? Are latency and throughput within acceptable ranges?
System Availability: Is your entire LLM pipeline functioning? This isn't just about the model being online - it's about all the components working together:
- API endpoint health
- Knowledge base connectivity
- Vector database availability
- Rate limit status (are you hitting API caps?)
- Queue health (is your job processor backing up?)
Response Times: How quickly is your model getting back to users? An LLM that takes 10 seconds to respond might technically be "working," but it's probably frustrating your users. Most applications aim for response times under 500ms, though this can vary based on your use case.
Request Volume: Are you handling 10 requests per second or 1000? This metric becomes important for capacity planning and cost management, especially with usage-based API pricing.
Error Tracking: Not all errors are created equal. You'll want to track different types:
- API timeouts
- Rate limit hits
- Token limit exceeded errors
- Invalid request errors
Token Usage: Tokens are the currency of LLM operations, and tracking them helps you:
- Stay within budget
- Optimize prompt design
- Forecast costs
- Identify potential prompt injection attacks (sudden spikes in token usage)
The beauty of monitoring is its simplicity - it gives you clear, actionable metrics that can trigger automated alerts. When your error rate spikes above 1% or response times creep above 200ms, you want to know immediately.
What is LLM observability?
LLM Observability goes beyond monitoring by providing a holistic understanding of the system’s behavior. It helps identify root causes and diagnose issues with logs, traces, and metrics.
Core pillars of observability
Logs: Detailed records of input-output pairs, errors, and warnings.
Tracing: Tracking requests across the entire pipeline, from prompt preprocessing to model response.
Metrics: Combining monitoring data with contextual insights to answer “why” something happened.
Feedback: Incorporating user feedback for continuous improvement.
Analytics: Using trends and outlier detection to predict future issues.
Example: Suppose a chatbot begins hallucinating responses in specific contexts. In that case, observability tools can trace the issue back to the prompt engineering or preprocessing stage, allowing teams to address the root cause effectively.
Observability vs monitoring: Key differences
| Aspect | Monitoring | Observability |
|---|---|---|
| Scope | Reactive, focused on metrics | Proactive, focused on diagnosis |
| Purpose | Ensures system health | Drives deeper understanding |
| Data Sources | Metrics and alerts | Logs, traces, metrics, feedback |
| Tools | Basic monitoring platforms | Advanced observability solutions |
To understand LLM observability vs monitoring, we take an example for a car's dashboard. Just as a car's dashboard and diagnostic system work together to maintain vehicle health, monitoring and observability collaborate to ensure your LLM system runs smoothly.
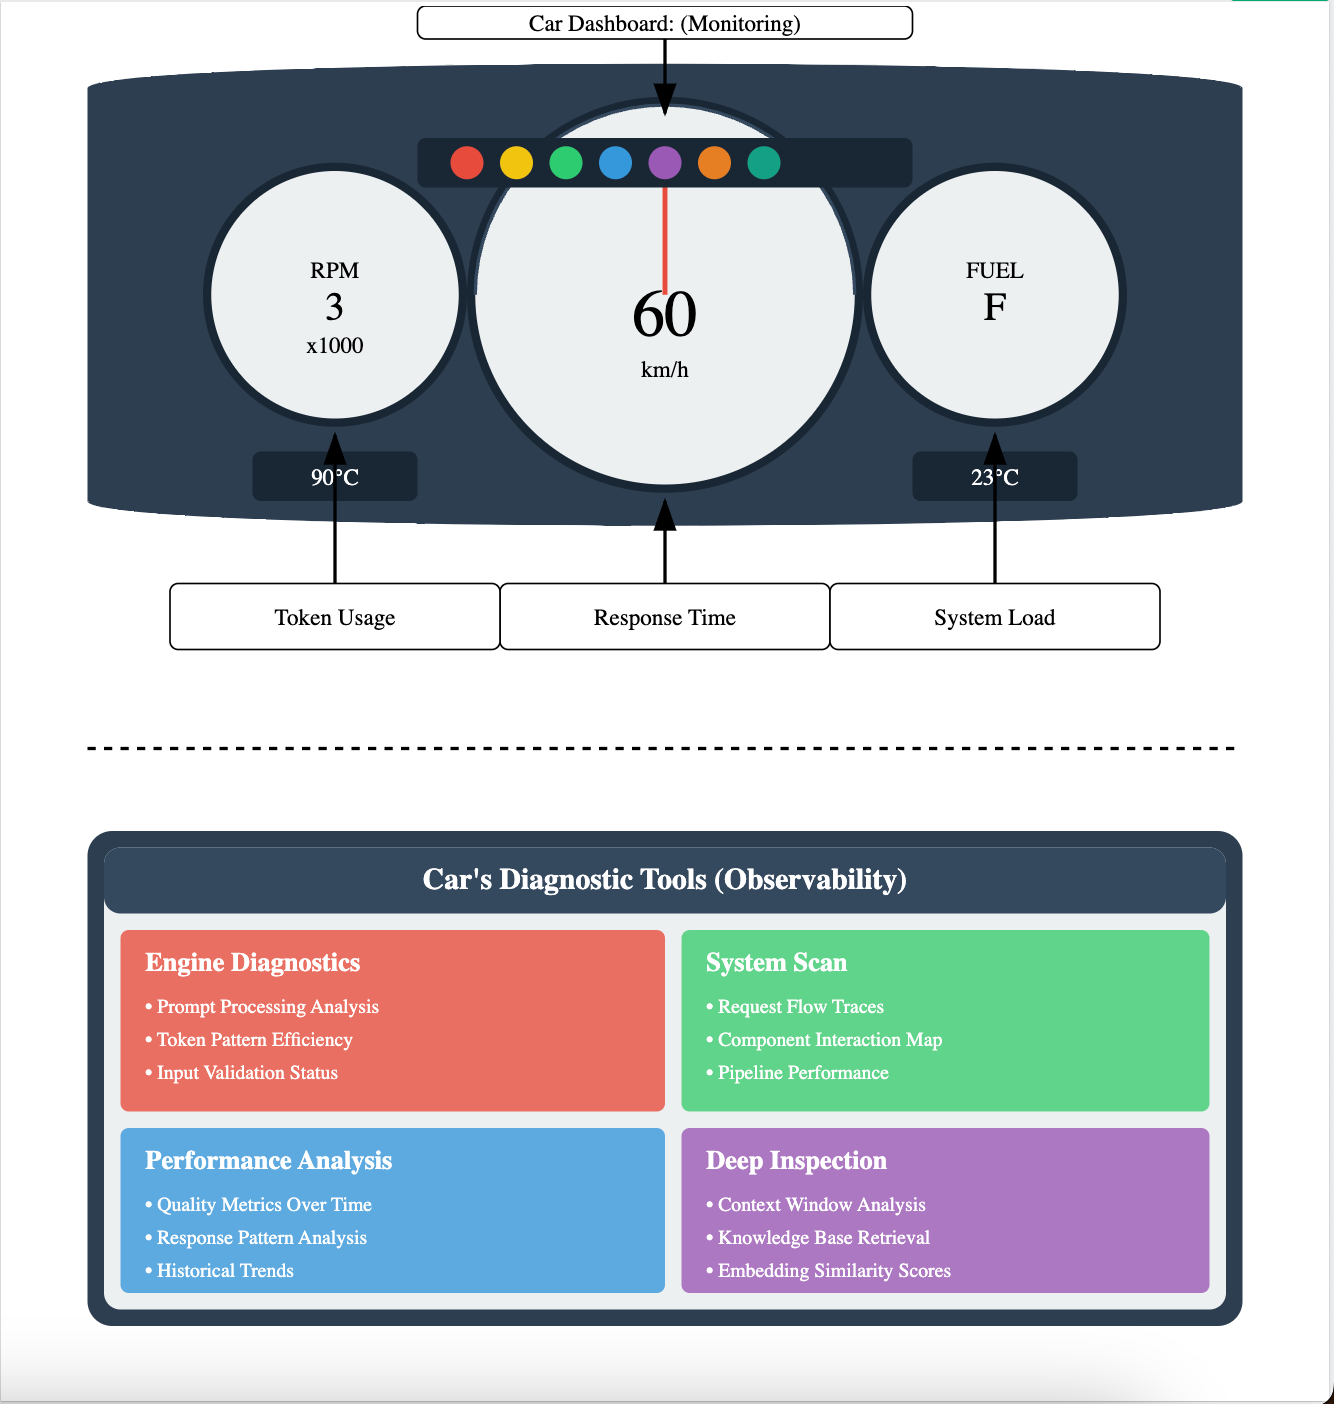
Think of the dashboard components as your real-time monitoring tools. The speedometer, representing response time, gives you immediate feedback on how quickly your LLM is processing requests. Just as you need to maintain a safe driving speed, you need to ensure your model responds within acceptable latency thresholds. The RPM gauge translates to token usage monitoring, helping you track resource consumption and manage costs effectively.
The system load indicator- the fuel gauge, helps you understand resource utilization. This is required for capacity planning and preventing system overload, much like keeping an eye on your fuel level prevents you from running empty. The warning lights serve as your immediate alert system, highlighting issues that need attention right away, from error spikes to unusual performance patterns.
Engine diagnostics dive deep into how your LLM processes prompts and handles tokens, similar to how a car's diagnostic system analyzes engine performance. This helps you understand not just that something's wrong, but why it's happening.
The system scan functionality traces requests through your entire LLM pipeline, mapping out how different components interact. This comprehensive view helps identify bottlenecks and optimization opportunities. Performance analysis provides historical context and trend data, helping you spot patterns and predict potential issues before they impact users. The deep inspection tools examine specific components in detail, from context window utilization to knowledge base retrieval patterns.
Challenges in implementing: monitoring vs observability
When you're setting up monitoring and observability for your LLM systems, you'll quickly run into some significant technical hurdles. Your monitoring tools will need to handle an enormous volume of data from every single model interaction. Consider this: each request isn't just a simple API call - it's a complete record of prompt-response pairs, token distributions, embedding vectors, and context window states. When your system processes thousands of requests per minute, your monitoring infrastructure needs robust scaling capabilities just to keep up with data ingestion and processing.
Data privacy adds a whole new dimension to your monitoring strategy. Your LLM system likely processes sensitive information - everything from proprietary business logic in prompts to potentially confidential information in responses. Implementing comprehensive monitoring while maintaining strict privacy standards isn't optional - it's essential. Your monitoring system needs to handle data masking, implement proper access controls, and ensure compliance with data protection regulations, all while still providing meaningful insights to your engineering team.
Perhaps the most complex challenge is connecting your technical monitoring metrics to actual business outcomes. As an AI developer, you'll need to work closely with business stakeholders to define which metrics actually matter. Response times and token usage are important, but how do they impact user satisfaction? What monitoring metrics best indicate the quality of your LLM's outputs? Your monitoring and observability solutions need to provide insights that not only help debug technical issues but also demonstrate clear business value.
How Portkey helps with observability and monitoring
Portkey has developed comprehensive tools that address both monitoring and observability needs for AI development teams working with LLMs. Let's look at how their platform handles the complexities of LLM management.
On the monitoring front, you get real-time visibility into your system's vital signs. The platform tracks essential metrics like response times and system throughput, and you can configure alerts based on your specific requirements. When your token usage spikes or latency exceeds thresholds, you'll know immediately. You'll also see detailed breakdowns of your API usage, helping you manage costs and resource allocation effectively.
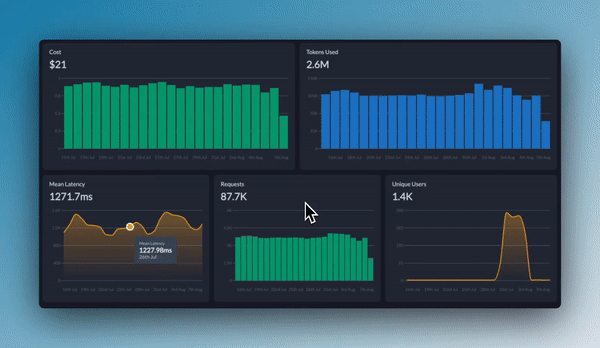
For observability(OpenTelemetry) , Portkey provides deeper insights into your LLM's behavior. You can trace individual requests through your entire system, analyze prompt-response patterns, and identify potential bottlenecks or issues. The platform maintains detailed logs of your LLM interactions, making it easier to diagnose problems when they occur. Their analytics tools help you understand trends and patterns in your model's performance, enabling data-driven optimizations.
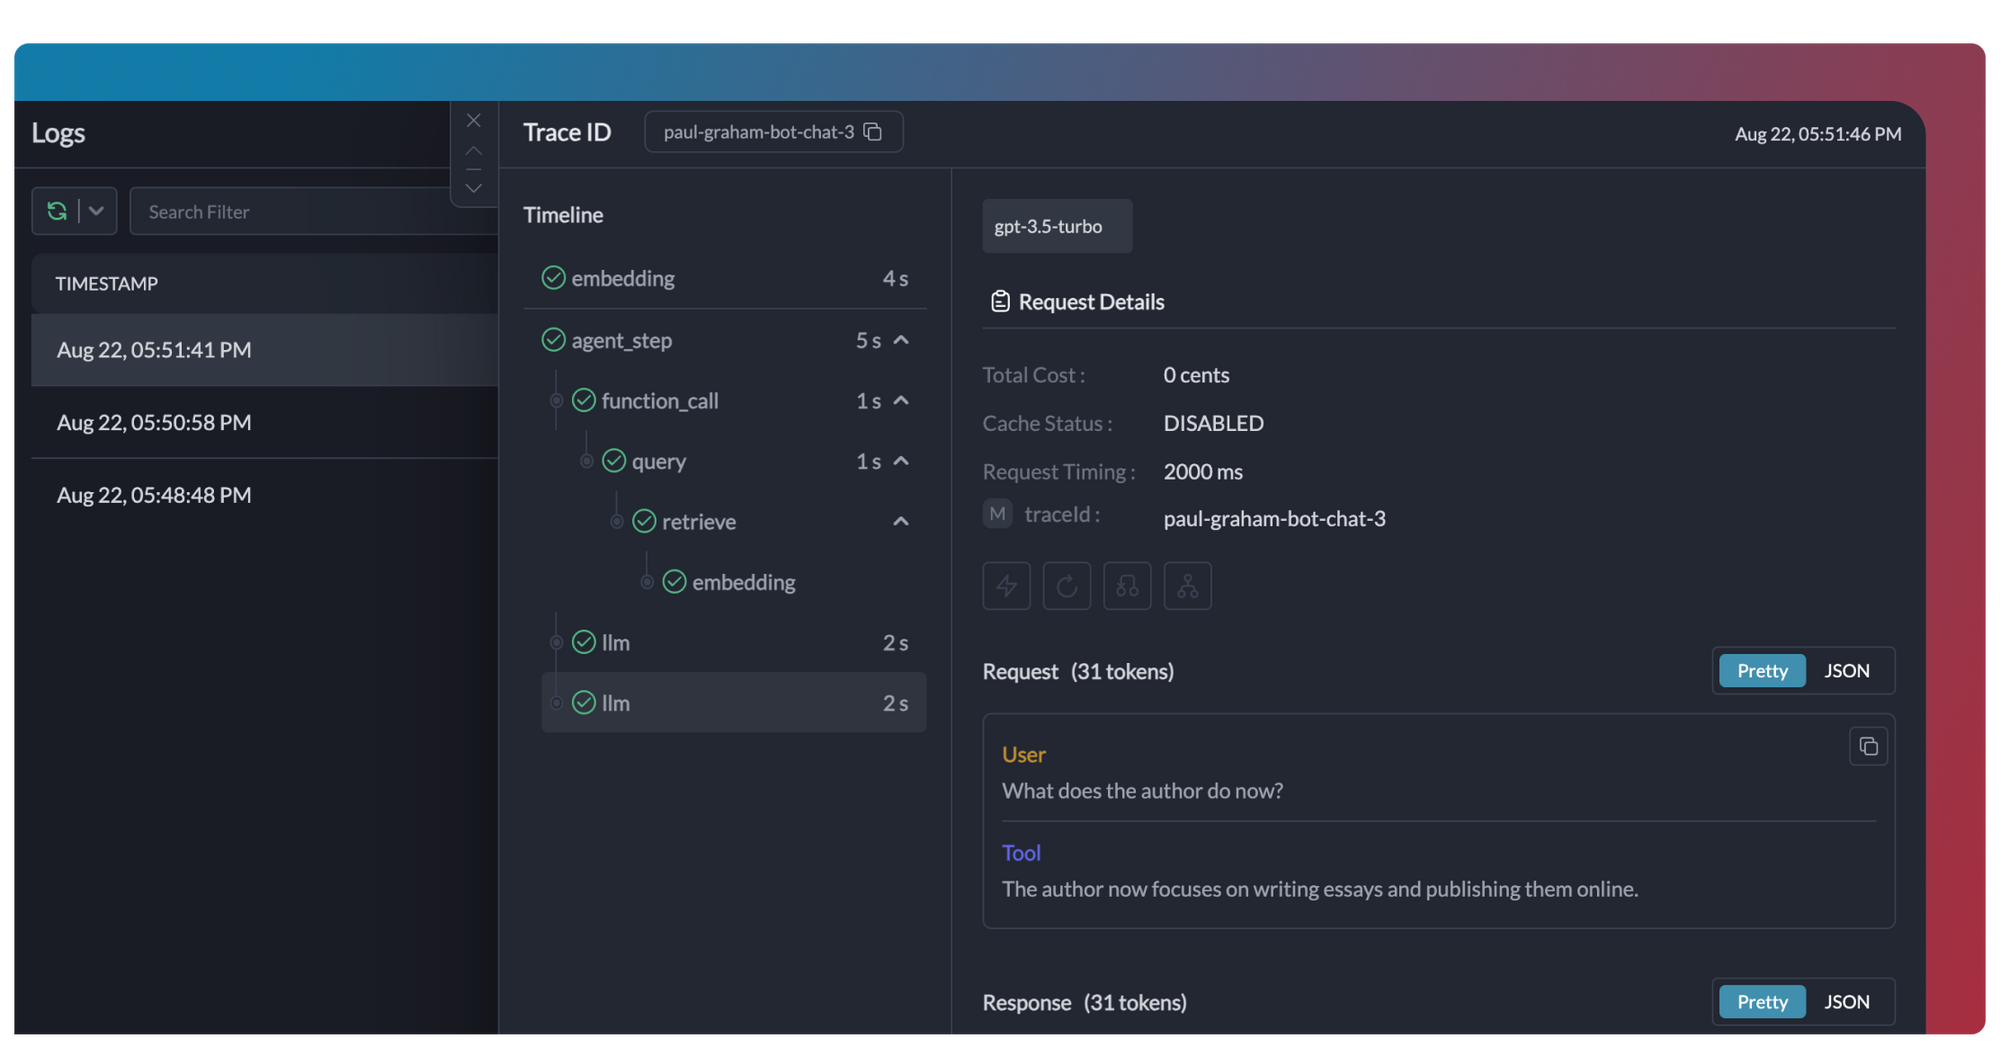
What sets their approach apart is how these monitoring and observability features work together. This integration helps reduce debugging time and makes it easier to maintain reliable LLM applications.
Best practices for monitoring and observability in LLMs
Start by setting up your monitoring as your first line of defense. Think of the key metrics that indicate your system's health - response times, error rates, and token usage patterns.
But detection is just the beginning. This is where observability becomes crucial. When monitoring flags an issue, your observability setup should help you quickly understand the root cause.
Build feedback loops into your system. When issues are detected and resolved, document the process and update your monitoring thresholds and observability parameters accordingly. If you notice certain patterns leading to problems, adjust your monitoring to catch these earlier.
Select tools and platforms that can scale with your needs. As your LLM applications grow, you'll need both detailed, request-level insights and high-level performance trends. Ensure your tooling can handle increased load while maintaining data granularity.
Remember to regularly review and refine your approach based on real incidents and team feedback. What worked for your initial deployment might need adjustment as your usage patterns evolve.
Understanding LLM observability vs monitoring and implementing both is essential for building reliable AI applications. While monitoring tells you when something's wrong, observability helps you understand why. Portkey combines both these essential capabilities in one integrated platform.
With Portkey, you get monitoring to watch your system's health metrics and observability tools to dig deep when needed. This combination ensures you're not just detecting issues, but actually understanding and fixing them at their root.
Want to see how Portkey can help your team better manage LLMs? Get started today.


