
Compare leading AI agent observability solutions and understand how they differ across tracing, cost attribution, debugging, and operational readiness for production agent systems.
What is AI agent observability?
AI agent observability is the ability to monitor, trace, and understand what your AI agents are doing in production, not just whether a request succeeded, but what decisions were made, which tools were called, how much it cost, and where things went wrong.
Unlike traditional application monitoring, agent observability has to account for non-deterministic behavior, multi-step reasoning chains, tool invocations, memory lookups, and LLM calls that can span dozens of hops across a single user interaction.
Core functions of an AI gateway
Distributed tracing across agent steps
Captures the full execution path of an agent run, from the initial user input through every LLM call, tool use, retrieval step, and sub-agent invocation, so teams can see exactly what happened and in what order.
LLM call logging
Records inputs, outputs, token counts, latency, and cost for every model call, giving teams the raw material to debug failures, catch regressions, and track spend per workflow.
Cost and token attribution
Breaks down usage and cost by user, team, agent, workflow, or environment, so organizations can allocate spend, enforce budgets, and identify which workflows are burning budget.
Audit trails and compliance logging
Maintains tamper-evident records of every agent interaction to support compliance, incident investigation, and governance requirements.
Alerting and anomaly detection
Notifies teams when error rates climb, costs or token exceed thresholds with real-time observability dashboards and alerting
Why teams need AI agent observability
Most teams start building agents with direct integrations and basic logging. As agent usage grows — more workflows, more users, more models, the gaps become critical.
The production challenges
Opaque multi-step behavior
When an agent fails or returns a bad response, there's no clear way to trace back through the reasoning chain to find where it went wrong. A single agent run might involve dozens of individual steps, and without tracing, the failure is invisible.
No cost attribution per workflow
Token usage and API costs accumulate across agents, teams, and environments with no visibility into what's driving spend.
Debugging failures in long agent chains
Errors in agentic workflows can propagate silently across steps. A bad retrieval at step 2 may not surface as a broken response until step 12, making root cause analysis extremely difficult without structured traces.
No continuous quality monitoring
Without an evaluation pipeline, quality is measured by user complaints. Teams have no systematic way to catch regressions after a prompt change, model update, or new tool integration.
Compliance gaps without audit trails
Regulated industries and enterprise environments increasingly require auditability of AI decisions. Fragmented logging across agents and environments makes this difficult to satisfy.
Governance without visibility
Teams cannot enforce budgets, rate limits, or access controls if they don't have reliable data on who is using what, and how often.
No visibility into MCP tool usage
Most observability platforms log LLM calls but have no awareness of MCP tool interactions, leaving a growing blind spot in agent behavior exactly where external actions are taken.
In-depth analysis of AI agent observability platforms
Dive deeper into each solution, covering their core strengths, weaknesses, pricing, customer base, and market reputation, to help teams choose the right AI Agent observability platform for their GenAI production stack.
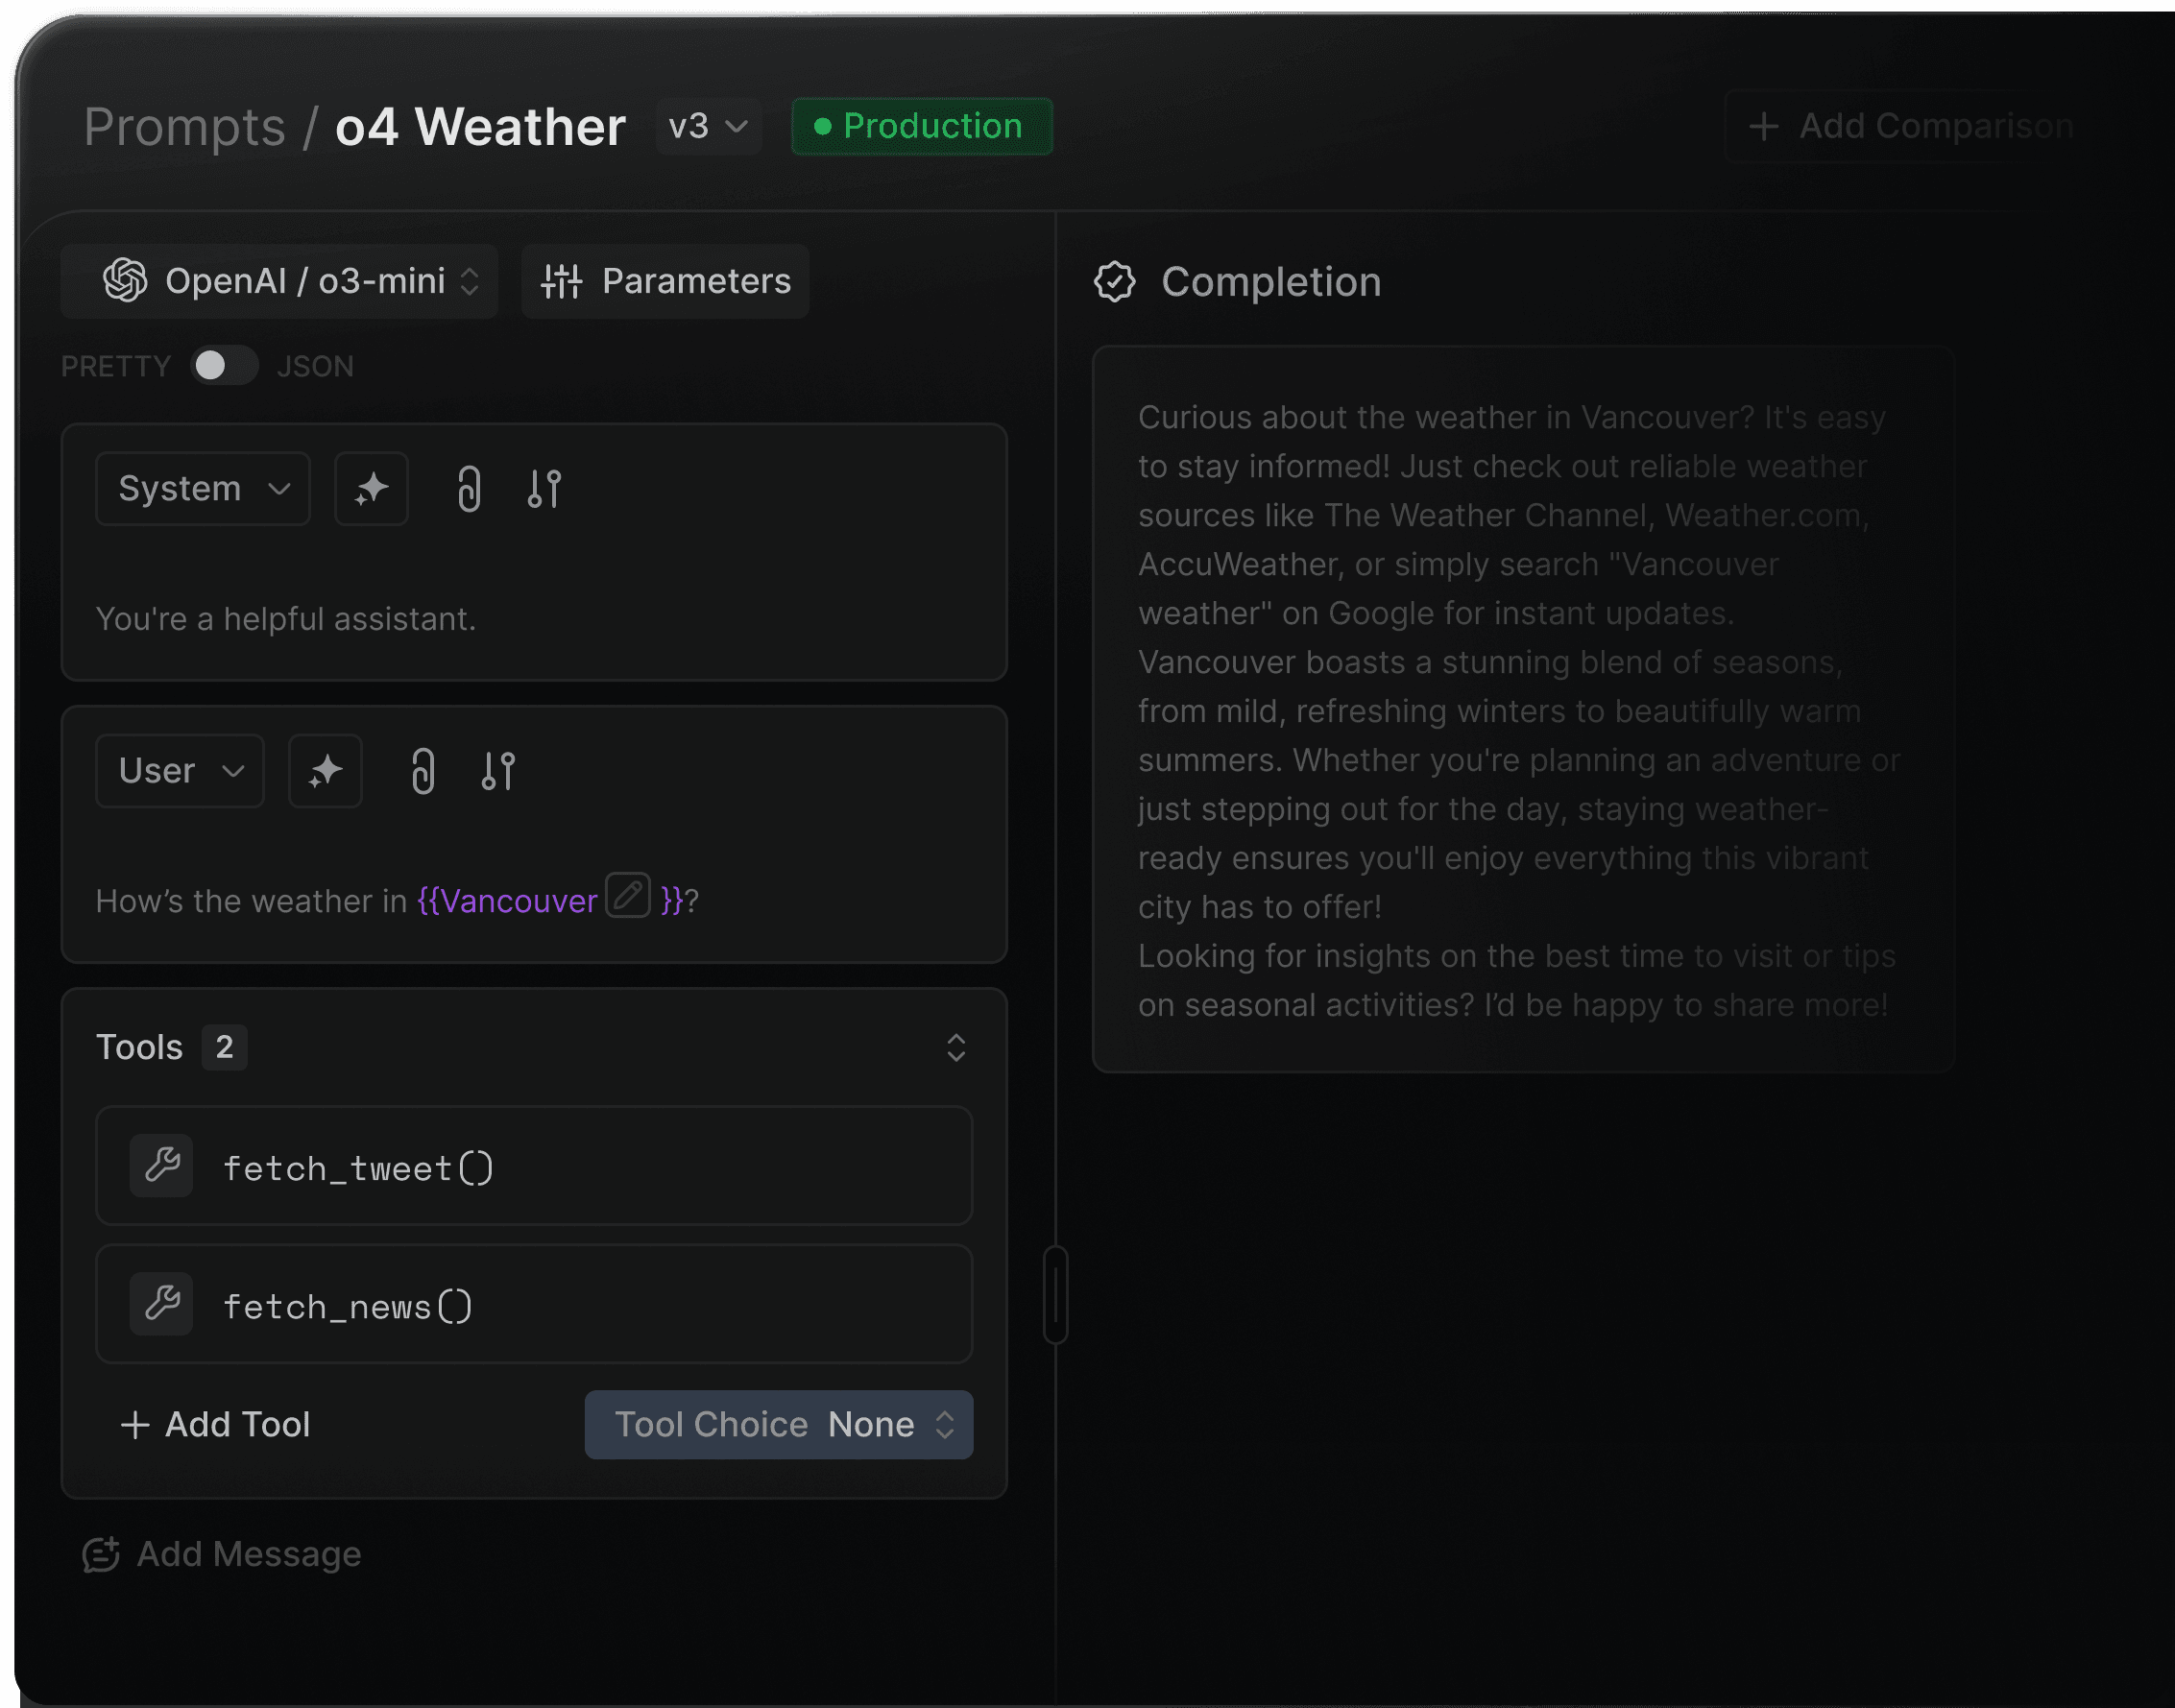
Portkey
Portkey combines full-stack observability with a production control plane. Rather than sitting alongside your stack, Portkey is the gateway your agent traffic flows through, so logging, tracing, cost tracking, and governance happen at the network layer by default, with no instrumentation gaps.
Strengths
Gateway-layer observability
Every LLM call and MCP tool invocation that flows through Portkey is automatically logged. Coverage is structural, not dependent on teams remembering to add SDK calls.
MCP tool call visibility
Logs every MCP tool invocation alongside LLM calls in the same trace, which server, which tool, inputs, outputs, latency, and authorization status. Most observability platforms don't cover MCP at all.
40+ fields per request
Captures cost, latency, token usage, model, provider, user, workspace, and status, along with guardrails checks on every request.
Governance tied to observability
Cost data feeds budget enforcement. User activity feeds RBAC policies and audit logs
Framework auto-instrumentation
Auto-instruments tracing for LangChain, LangGraph, CrewAI, OpenAI Agents SDK, etc., no manual span creation needed.
OpenTelemetry export
Pipes standardized telemetry to Arize Phoenix, Pydantic Logfire, FutureAGI, and other monitoring systems for teams that want to enrich existing pipelines.
Limitations
Primarily designed for production teams, so lightweight prototypes may find it more advanced than needed.
Observability is tightly coupled to the gateway; teams that want standalone tracing without routing and governance will find the setup broader than they need
Evaluation pipelines are not built in. Teams that need automated quality scoring in the same product will need to integrate an eval tool
Pricing Structure
Portkey offers a usage-based pricing model with a free tier for initial development and testing. Enterprise plans include advanced governance, audit logging, and dedicated regional deployments.
Ideal For / Typical Users
Platform teams that want observability and governance in a single system
Organizations that need cost attribution, audit trails, and RBAC alongside tracing
Teams in regulated industries with HIPAA, GDPR, or SOC 2 requirements
Any team adopting MCP who needs visibility into tool usage, not just model calls

4.8/5 on G2 — praised for its developer-friendly SDKs, observability depth, and governance flexibility.

LangSmith
LangSmith is LangChain's observability and testing platform, built specifically for LangChain and LangGraph applications. If your stack runs on those frameworks, setup is a single environment variable, no additional instrumentation needed.
Strengths
Single env variable setup for LangChain apps
Set LANGSMITH_TRACING=true and tracing starts. No SDK calls, no custom spans. LangSmith understands LangChain's internals automatically.
Execution graph visualization
Renders agent workflows as graphs, showing each step from initial prompt through tool calls to final output, making it easy to spot where runs go wrong.
Polly AI assistant
Built-in AI assistant that analyzes traces and surfaces insights about application performance without manual querying.
Alerting and automation rules
Set threshold-based alerts on error rate, latency, and feedback scores; trigger webhooks and Slack notifications when conditions are met.
OTel support
OpenTelemetry support enables traces to be sent to other backends alongside LangSmith.
Limitations
Observability is tightly coupled to the gateway; teams that want standalone tracing without routing and governance will find the setup broader than they need
CI/CD gating requires custom setup — LangSmith supports running evals in GitHub workflows, but teams have to wire up their own assertions and pipeline logic
Closed source, no ability to inspect, extend, or modify the platform itself
Pricing Structure
Free tier: 5k traces/month, 1 seat. Paid plans from $39/user/month. Enterprise with self-hosting available.
Ideal For / Typical Users
Teams standardized on LangChain or LangGraph who want zero-friction tracing
Organizations that don't need cross-framework or multi-provider observability
Developer teams that want a framework-native debugging experience

Langfuse
Langfuse is an open-source LLM observability platform. It covers tracing, prompt management, and evaluations with full self-hosting support, and is widely adopted by teams that need complete data sovereignty.
Strengths
Fully open-source
All features available with no licensing restrictions, including LLM-as-judge evaluations, annotation queues, and prompt management.
Tool call visibility for agents
Improved agent tracing with inline tool call details, arguments, available vs. selected tools, and agent graph visualizations for complex multi-framework workflows.
Prompt versioning built in
Manage, version, and deploy prompts directly from Langfuse, no separate tool needed.
OTel-native
Built on OpenTelemetry. Traces can be sent to multiple backends simultaneously, Langfuse for LLM observability, Datadog for infrastructure.
Limitations
Self-hosting requires managing PostgreSQL, ClickHouse, Redis, and Kubernetes; the infrastructure overhead is real and falls entirely on your team.
Experiments run separately from live monitoring; evaluation results don't automatically link to production traces, so correlation is a manual step.
Non-technical team members can't run prompt iteration cycles directly; there's no way to invoke your AI application for experimentation without engineering involvement.
Pricing Structure
Free: 50k observations/month. Pro: $59/month.
Ideal For / Typical Users
Teams that require full data sovereignty and prefer self-hosting
Regulated industries where third-party data handling is restricted
Engineering teams comfortable managing entire infrastructure
Arize Phoenix
Arize Phoenix is an open-source observability and evaluation framework from Arize AI. It is OTel-native, vendor and framework agnostic, and supports tracing across LLMs, agents, RAG pipelines, and multi-modal workflows. Phoenix is the open-source product; Arize AX is the enterprise SaaS platform. Both exist separately.
Strengths
OTel-native, vendor and framework agnostic
Works with LangChain, LangGraph, CrewAI, OpenAI Agents SDK, LlamaIndex, DSPy, Haystack, and more with no framework lock-in.
MCP tracing support
Phoenix unifies MCP traces via the openinference-instrumentation-mcp package, which propagates context between MCP clients and servers so client and server spans appear as a single connected trace.
Embedding analysis and clustering
Heatmap-based analysis of embedding spaces to surface failure modes and data drift, useful for RAG pipelines running alongside agents.
Unified ML and LLM monitoring
The enterprise platform covers predictive ML, computer vision, and generative AI in one view, valuable for orgs running both types of workloads.
Limitations
Primarily a tracing and evaluation tool with no built-in routing, cost governance, or access control; needs to be combined with other infrastructure
MCP tracing requires instrumentation on both the client and server side; there's no automatic coverage without code changes in both places
Self-hosting Phoenix requires engineering time to deploy, configure, and maintain
Pricing Structure
Phoenix open-source: free. Managed cloud: starts at $50/month. Enterprise (Arize AX): custom pricing.
Ideal For / Typical Users
ML platform teams monitoring both classical ML and LLM/agent workloads
Teams that want OTel-native tracing with no vendor dependency
Organizations with engineering resources to self-host and manage infrastructure
Braintrust
Braintrust is an eval-first AI development platform. Where other tools log what agents do, Braintrust measures whether what they did was good, integrating automated evaluation directly into the observability workflow.
Strengths
Exhaustive trace coverage out of the box
Every trace automatically captures duration, LLM duration, time to first token, LLM calls, tool calls, and errors with no custom configuration needed.
Granular cost analytics
Per-request cost breakdowns by prompt and completion tokens, aggregated by user, feature, model, or custom grouping.
Unified data model across production and testing
Logs and experiments use the same data structure, so production traces become evaluation datasets directly and instrumentation code works for both without duplication.
Purpose-built database for AI trace scale
Brainstore is built specifically for AI logs, handling the large, nested traces that traditional observability databases struggle with, and keeping query times fast at production scale.
Limitations
AI capabilities are extensions, not core design — lacks deep observability and cost intelligence for LLM workloads
Limited multi-provider LLM orchestration, routing logic, or model-aware optimizations (latency-based routing, canaries, cost-aware fallback).
No built-in LLM guardrails, jailbreak detection, evaluations, or policy enforcement beyond generic API rules.
Requires configuration and DevOps involvement; not optimized for rapid GenAI iteration.
Governance and monitoring are API-centric, not request/token-centric like modern AI gateways.
Pricing Structure
Free: 1M spans, 10k scores. Pro: $249/month (unlimited spans and scores). Enterprise: custom.
Ideal For / Typical Users
Product and engineering teams that need systematic quality measurement, not just logs
Teams where product managers need direct access to observability data alongside engineers

Maxim AI — Bifrost
Maxim AI is a full-lifecycle AI agent platform covering simulation, evaluation, and production observability in a single product. It is designed for teams that want to connect pre-deployment testing directly to production monitoring without managing separate tools.
Strengths
Distributed tracing at every level
Traces sessions, spans, generations, tool calls, and retrieval steps, capturing full execution paths through multi-agent workflows.
Real-time alerting
Custom thresholds on latency, cost, error rate, and evaluator scores.
In-production automated evaluation
Runs custom evaluators (LLM-as-judge, deterministic, statistical, or human-scored) continuously on live traffic, not just in development.
OTel support with external forwarding
Supports OpenTelemetry and can forward traces to New Relic, Snowflake, and other platforms, so Maxim sits alongside existing observability stacks.
Limitations
Breadth of features (simulation, eval, observability, gateway) creates a learning curve; teams that only need observability may find the product larger than needed
No built-in routing governance or access control; teams need separate infrastructure for RBAC, budgets, and audit logs
No MCP connector support; teams that need agents integrated with third-party tools via MCP have to build those connections themselves or source them elsewhere
Pricing Structure
Free tier: 3 seats, 10k agent logs/month. Pro: $29/user/month. Business: $49/user/month. Enterprise: custom.
Ideal For / Typical Users
Teams that want simulation and production observability in a single platform
Cross-functional teams where product managers and engineers need shared visibility into agent quality
Organizations consolidating separate testing and monitoring tools

Helicone
Helicone is an open-source LLM observability platform, built with a "one-line integration" approach. It provides detailed request logging, prompt management, caching, rate limiting, and fallbacks across 100+ models through an OpenAI-compatible gateway.
Strengths
One-line integration
Change the base URL in your existing client. Logging starts immediately with no SDK, no instrumentation, no setup time.
100+ models, zero markup
Supports 100+ LLM providers through a single endpoint with no per-request markup on model costs.
Cost-based routing and smart fallbacks
Automatically routes to the cheapest available provider. Falls back across providers on failure with no code changes required.
Self-hostable
Deploy Helicone in your own VPC using Docker or Kubernetes for full data sovereignty.
Limitations
Proxy architecture limits tracing depth; tool calls, sub-agent steps, and complex agent reasoning chains are not captured with the same granularity as SDK-based platforms
No built-in evaluation; quality scoring, LLM-as-judge, and regression testing require a separate tool
Adding a proxy to every request creates a single point of failure and a network hop; teams with strict latency or reliability requirements should evaluate carefully
Not suitable for complex multi-agent observability; designed for LLM call logging, not full agent lifecycle tracing
Pricing Structure
Free: 100k requests/month. Pro: $25/month flat (unlimited requests). Enterprise: custom.
Ideal For / Typical Users
Teams at early stages who need basic observability without an integration project
Developers who want cost and usage visibility with minimal setup
Organizations that want proxy-based logging before investing in SDK-based tracing
Custom Gateway Solutions
Some engineering teams choose to build their own AI gateway or proxy layer using open-source components, internal microservices, or cloud primitives.
These “custom gateways” often start as simple proxies for OpenAI or Anthropic calls and gradually evolve into internal platforms handling routing, logging, and key management.
While they offer full control, they require significant ongoing engineering, security, and maintenance investment to keep up with the rapidly expanding LLM ecosystem.
Strengths
Full customization:
Every component can be tailored to internal needs.
Complete control over data flow:
Easy to enforce organization-specific data policies or network isolation.
Deep integration with internal stacks:
Fits seamlessly into proprietary systems, legacy infrastructure, or internal developer platforms.
Potentially lower cost at a very small scale:
If only supporting a single provider or simple routing logic.
Limitations
High engineering burden: implementing and maintaining routing, retries, fallbacks, logging, key rotation, credentials, dashboards, and guardrails is complex.
Difficult to keep up with fast-moving LLM features—function calling, new provider APIs, model updates, safety settings, embeddings, multimodal inputs, etc.
No built-in observability: requires building token tracking, latency metrics, per-user analytics, cost dashboards, and log pipelines.
Security and governance debt: RBAC, workspace separation, policy enforcement, audit logs, and compliance controls require significant effort.
Reliability challenges: implementing circuit breakers, provider failover, shadow testing, canary routing, and load balancing is nontrivial.
Higher opportunity cost — engineers spend time maintaining infrastructure rather than building AI products.
Pricing Structure
No fixed pricing — the cost is measured in engineering hours, cloud resources, and operational overhead. Over time, most teams report that maintaining custom gateways costs more than adopting a purpose-built platform, especially once governance, observability, and multi-provider support become requirements.
Ideal For / Typical Users
Highly specialized engineering teams with unique compliance or architectural constraints that cannot be met by commercial platforms, and who have the bandwidth to maintain internal infrastructure.
Key capabilities of LLM Gateways
Unified Endpoint
Connect to any LLM via a single API.
Multi-Model Routing
Dynamically route requests to OpenAI, Anthropic, Mistral, etc.
Caching & Rate Limiting
Optimize latency and cost.
Key Management
Securely store and rotate provider keys.
Observability:
Track token usage, latency, and performance.
Governance & Guardrails:
Enforce content policies and access control.
Why Portkey is different
Governance at scale
Built for enterprise control from day one
Workspaces and role-based access
Budgets, rate limits, and quotas
Data residency controls
SSO, SCIM, audit logs
Policy-as-code for consistent enforcement
HIPAA
COMPLIANT
GDPR
Complete visibility into every request
Token and cost analytics
Latency traces
Transformed logs for debugging
Workspace, team, and model-level insights
Error clustering and performance trends
Unified SDKs and APIs
A single interface for 1,600+ LLMs and embeddings across OpenAI, Anthropic, Mistral, Gemini, Cohere, Bedrock, Azure, and local deployments.
Guardrails and safety
PII redaction
Jailbreak detection
Toxicity and safety filters
Request and response policy checks
Moderation pipelines for agentic workflows
Prompt and context management
Template versioning, variable substitution, environment promotion, and approval flows to maintain clean, reproducible prompt pipelines.
Portkey unifies everything teams need to build, scale, and govern GenAI systems — with the reliability and control that production demands
Reliability automation
Sophisticated failover and
routing built into the gateway:
Fallbacks and retries
Canary and A/B routing
Latency and cost-based selection
Provider health checks
Circuit breakers and dynamic throttling
Architecture overview
Portkey sits at the center of the GenAI stack as the control plane that every model call and tool interaction passes through. When an application, agent, or backend service sends a request, it first reaches Portkey’s gateway layer. This is where authentication, access rules, key management, routing logic, caching, rate limits, guardrails, and reliability controls are applied. Instead of each application implementing its own logic, Portkey standardizes this behavior across the entire organization.
From the gateway, the request is routed to the appropriate model provider or internal model. Portkey supports the full ecosystem — OpenAI, Anthropic, Mistral, Google Gemini, Cohere, Hugging Face, Bedrock, Azure OpenAI, Ollama, and custom enterprise-hosted LLMs. Provider differences, credentials, model versions, and health checks are all abstracted behind a single consistent interface.
Portkey also routes MCP tool calls. MCP servers are registered and discovered through Portkey, allowing agents to call external tools with the same governance, access controls, and observability as model requests.
Tool executions, context loads, errors, and policies are all enforced within the same control plane. Every interaction—whether a model call or a tool invocation—is captured by Portkey’s observability layer. Logs, transformed traces, latency breakdowns, token and cost analytics, error patterns, and replay data flow into a unified telemetry stream. This gives teams a real-time understanding of system behavior, performance, and spend without instrumenting anything manually.
All of this rolls up into Portkey’s governance layer, where organizations manage workspaces, roles, budgets, rate limits, data residency, audit trails, and policy-as-code. This is where compliance and operational controls are defined and consistently enforced across teams and applications.
Together, these layers form a single architecture: applications send requests, Portkey governs and routes them, providers execute them, and all telemetry flows back into a governed control plane. It replaces the fragmented mix of proxies, scripts, dashboards, and ad-hoc control mechanisms with one unified platform built for production-grade GenAI.
Use Cases
Portkey is designed to support a wide range of GenAI applications, from early prototypes evolving into production systems to large-scale enterprise deployments.
Teams building AI copilots, agents, and workflows use Portkey as the backbone that keeps every model call and tool invocation reliable, governed, and traceable as projects grow from prototype to production.
As applications span multiple models, providers, and tools, Portkey ensures consistent behavior across all workflows without requiring developers to rewrite internal logic or maintain provider-specific complexity.
Enterprise AI teams use Portkey to centralize access to models and tools, replacing scattered provider keys, credentials, and policies with a single control plane that enforces budgets, quotas, permissions, and compliance rules.
Organizations with many teams and departments rely on Portkey to standardize AI access, making onboarding easier and ensuring that usage, safety, and governance requirements are applied uniformly.
Product and platform engineering teams use Portkey to move from experimentation to stable production, with clear visibility into latency, costs, token usage, and model behavior—without building internal dashboards or handling vendor fragmentation.
Companies using both hosted and internally deployed models use Portkey to unify provider and self-hosted LLM access behind the same gateway, making routing, governance, and observability consistent across all inference sources.
Integrations


Portkey connects to the full GenAI ecosystem through a unified control plane. Every integration works through the same consistent gateway. This gives teams one place to manage routing, governance, cost controls, and observability across their entire AI stack.

Portkey supports integrations with all major LLM providers, including OpenAI, Anthropic, Mistral, Google Gemini, Cohere, Hugging Face, AWS Bedrock, Azure OpenAI, and many more. These connections cover text, vision, embeddings, streaming, and function calling, and extend to open-source and locally hosted models.

Beyond models, Portkey integrates directly with the major cloud AI platforms. Teams running on AWS, Azure, or Google Cloud can route requests to managed model endpoints, regional deployments, private VPC environments, or enterprise-hosted LLMs—all behind the same Portkey endpoint.

Integrations with systems like Palo Alto Networks Prisma AIRS, Patronus, and other content-safety and compliance engines allow organizations to enforce redaction, filtering, jailbreak detection, and safety policies directly at the gateway level. These controls apply consistently across every model, provider, app, and tool.

Frameworks such as LangChain, LangGraph, CrewAI, OpenAI Agents SDK, etc. route all of their model calls and tool interactions through Portkey, ensuring agents inherit the same routing, guardrails, governance, retries, and cost controls as core applications.

Portkey integrates with vector stores and retrieval infrastructure, including platforms like Pinecone, Weaviate, Chroma, LanceDB, etc. This allows teams to unify their retrieval pipelines with the same policy and governance layer used for LLM calls, simplifying both RAG and hybrid search flows.

Tools such as Claude Code, Cursor, LibreChat, and OpenWebUI can send inference requests through Portkey, giving organizations full visibility into token usage, latency, cost, and user activity, even when these apps run on local machines.

For teams needing deep visibility, Portkey integrates with monitoring and tracing systems like Arize Phoenix, FutureAGI, Pydantic Logfire and more. These systems ingest Portkey’s standardized telemetry, allowing organizations to correlate model performance with application behavior.

Finally, Portkey connects with all major MCP clients, including Claude Desktop, Claude Code, Cursor, VS Code extensions, and any MCP-capable IDE or agent runtime.
Across all of these categories, Portkey acts as the unifying operational layer. It replaces a fragmented integration landscape with a single, governed, observable, and reliable control plane for the entire GenAI ecosystem.


Get started
Portkey gives teams a single control plane to build, scale, and govern GenAI applications in production with multi-provider support, built-in safety and governance, and end-to-end visibility from day one.


