Documentation Index
Fetch the complete documentation index at: https://docs.portkey.ai/docs/llms.txt
Use this file to discover all available pages before exploring further.
This feature is available for all plans:-
- Developer: 30 days retention
- Production: 365 days retention
- Enterprise: Unlimited

Charts
The dashboard provides insights into your users, errors, cache, feedback and also summarizes information by metadata.Overview
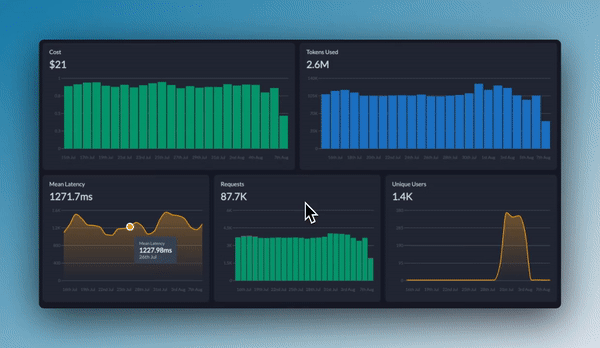
The overview tab is a 70,000ft view of your application’s performance. This highlights the cost, tokens used, mean latency, requests and information on your users and top models. This is a good starting point to then dive deeper.Users
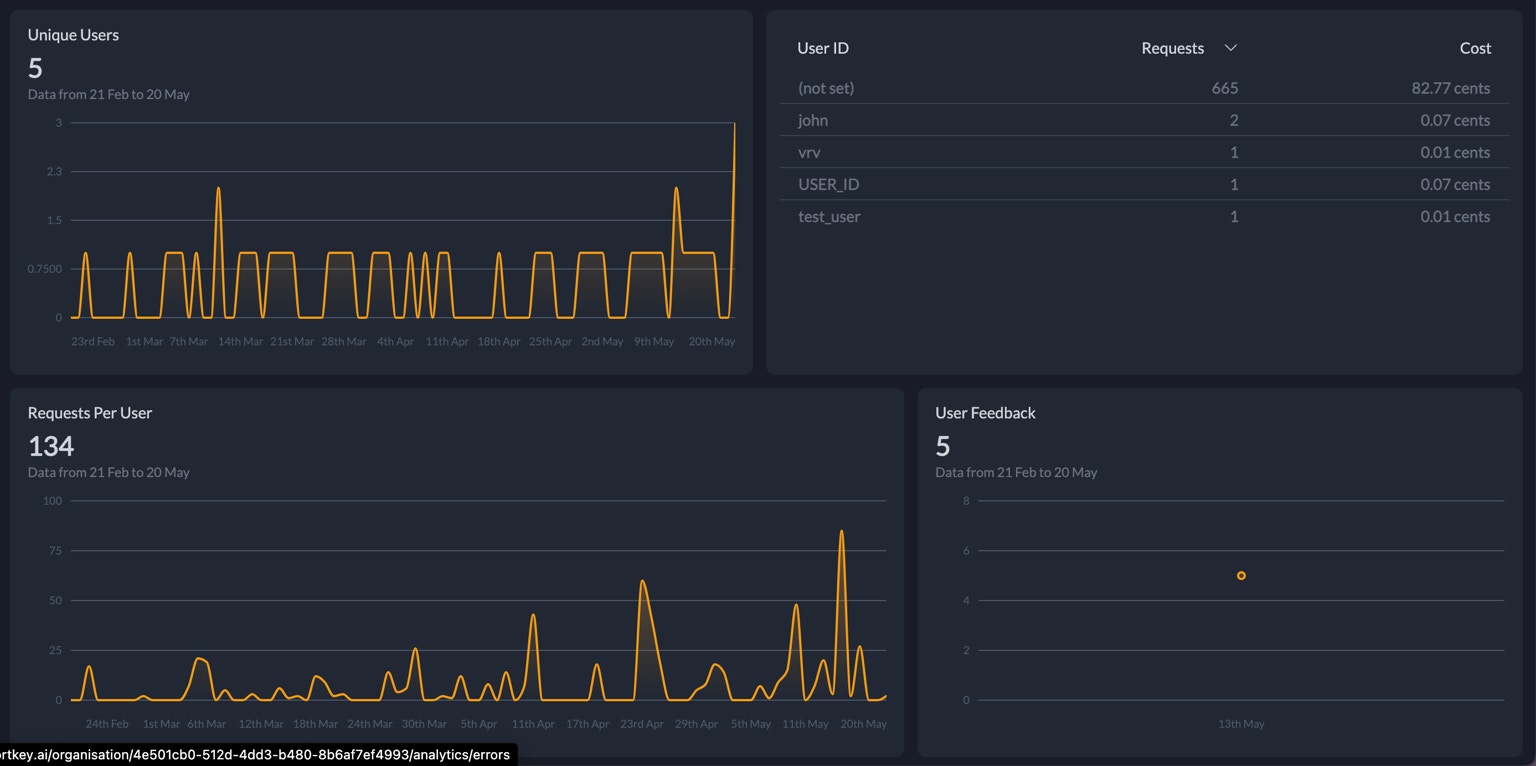
The users tab provides an overview of the user information associated with your Portkey requests. This data is derived from theuser parameter in OpenAI SDK requests or the special _user key in the Portkey metadata header.
Portkey currently does not provide analytics on usage patterns for individual team members in your Portkey organization. The users tab is designed to track end-user behavior in your application, not internal team usage.

Errors
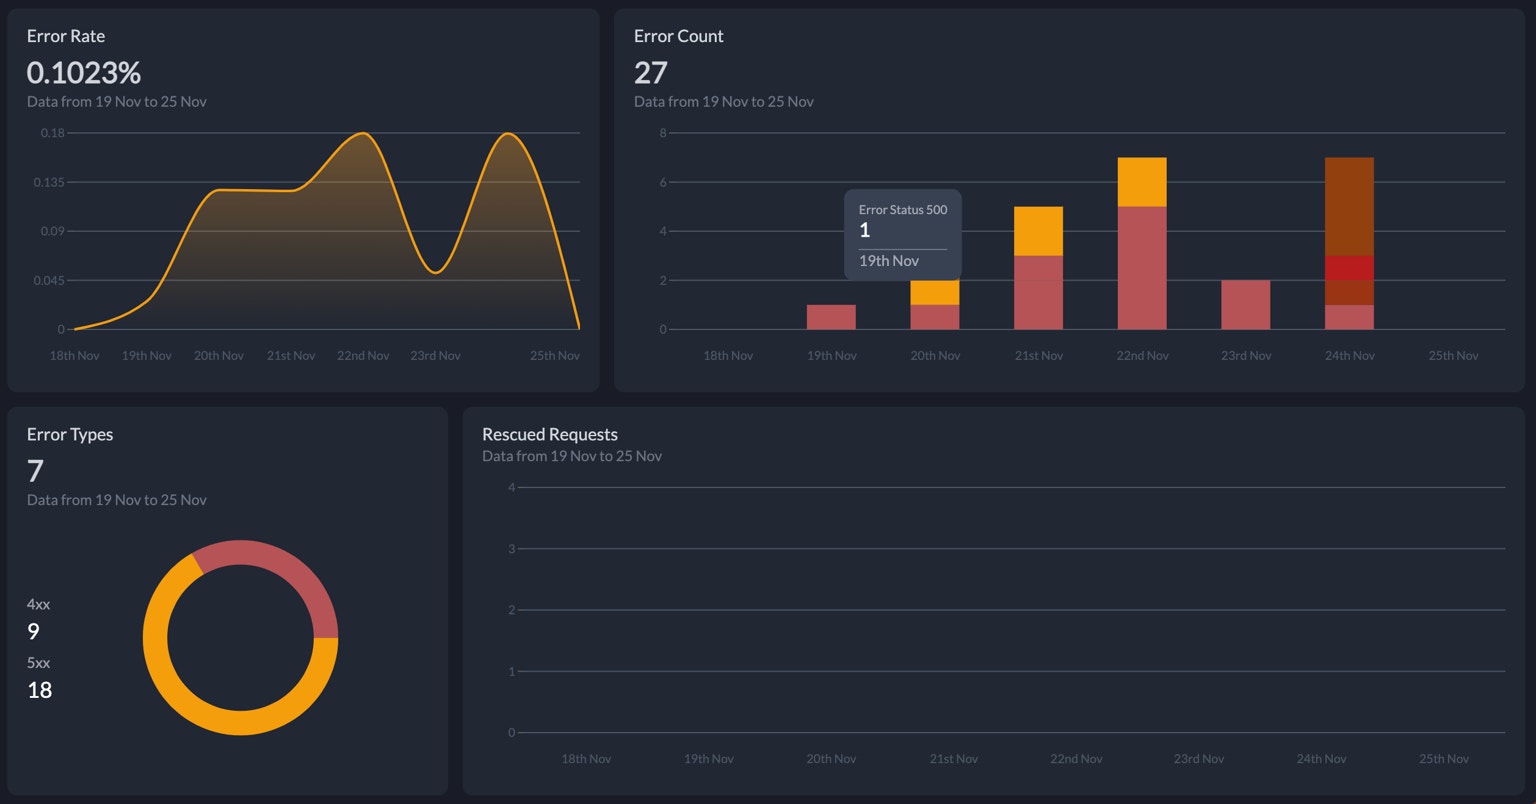
Portkey captures errors automatically for API and Accuracy errors. The charts give you a quick sense of error rates allowing you to debug further when needed. The dashboard also shows you the number of requests rescued by Portkey through the various AI gateway strategies.
Cache
When you enable cache through the AI gateway, you can view data on the latency improvements and cost savings due to cache.Feedback
Portkey allows you to collect feedback on LLM requests through the logs dashboard or via API. You can view analytics on this feedback collected on this dashboard.Metadata Summary
Group your request data by metadata parameters to unlock insights on usage. Select the metadata property to use in the dropdown and view the request data grouped by values of that metadata parameter. This lets you answer questions like:- Which users are we spending the most on?
- Which organisations have the highest latency?


