The Portkey Advantage: Gateway Intelligence Meets Full-Stack Observability
Portkey’s strength lies in its unique combination of an intelligent LLM Gateway and a powerful Observability backend.- Enriched Data from the Gateway: Your LLM calls routed through the Portkey Gateway are automatically enriched with deep contextual information—provider configuration, caching status, retry attempts, prompt versions, and more. This data flows seamlessly into Portkey Observability.
- Holistic View with OpenTelemetry: By adding an OTel endpoint, Portkey now ingests traces and logs from your entire application stack, not just the LLM calls. Instrument your frontend, backend services, databases, and any other component with OTel, and send that data to Portkey.
How OpenTelemetry Data Flows to Portkey
The following diagram illustrates how telemetry data from your instrumented applications and the Portkey Gateway itself is consolidated within Portkey Observability: Explanation:- Your Application Code is instrumented using OTel Instrumentation Libraries.
- This telemetry data (traces, logs) can be sent to the Portkey OTel Backend Endpoint.
- Simultaneously, LLM calls made via the Portkey Gateway generate their own rich, structured telemetry.
- All this data is consolidated in the Portkey Observability Stack, giving you a unified view.
Setting Up Portkey as an OpenTelemetry Backend
To send your OpenTelemetry data to Portkey, configure your OTel exporter to point to Portkey’s OTLP endpoint and provide your Portkey API Key for authentication. Key Environment Variables:Replace
YOUR_PORTKEY_API_KEY with your actual Portkey API Key found in your Portkey Dashboard.OTEL_EXPORTER_OTLP_TRACES_ENDPOINT="https://api.portkey.ai/v1/otel/v1/traces"
For Logs:
OTEL_EXPORTER_OTLP_LOGS_ENDPOINT="https://api.portkey.ai/v1/otel/v1/logs"
Remember to include the
OTEL_EXPORTER_OTLP_HEADERS with your API key for these as well.Viewing Traces
Once configured, your OpenTelemetry traces appear in the Portkey dashboard with full visibility for your AI application: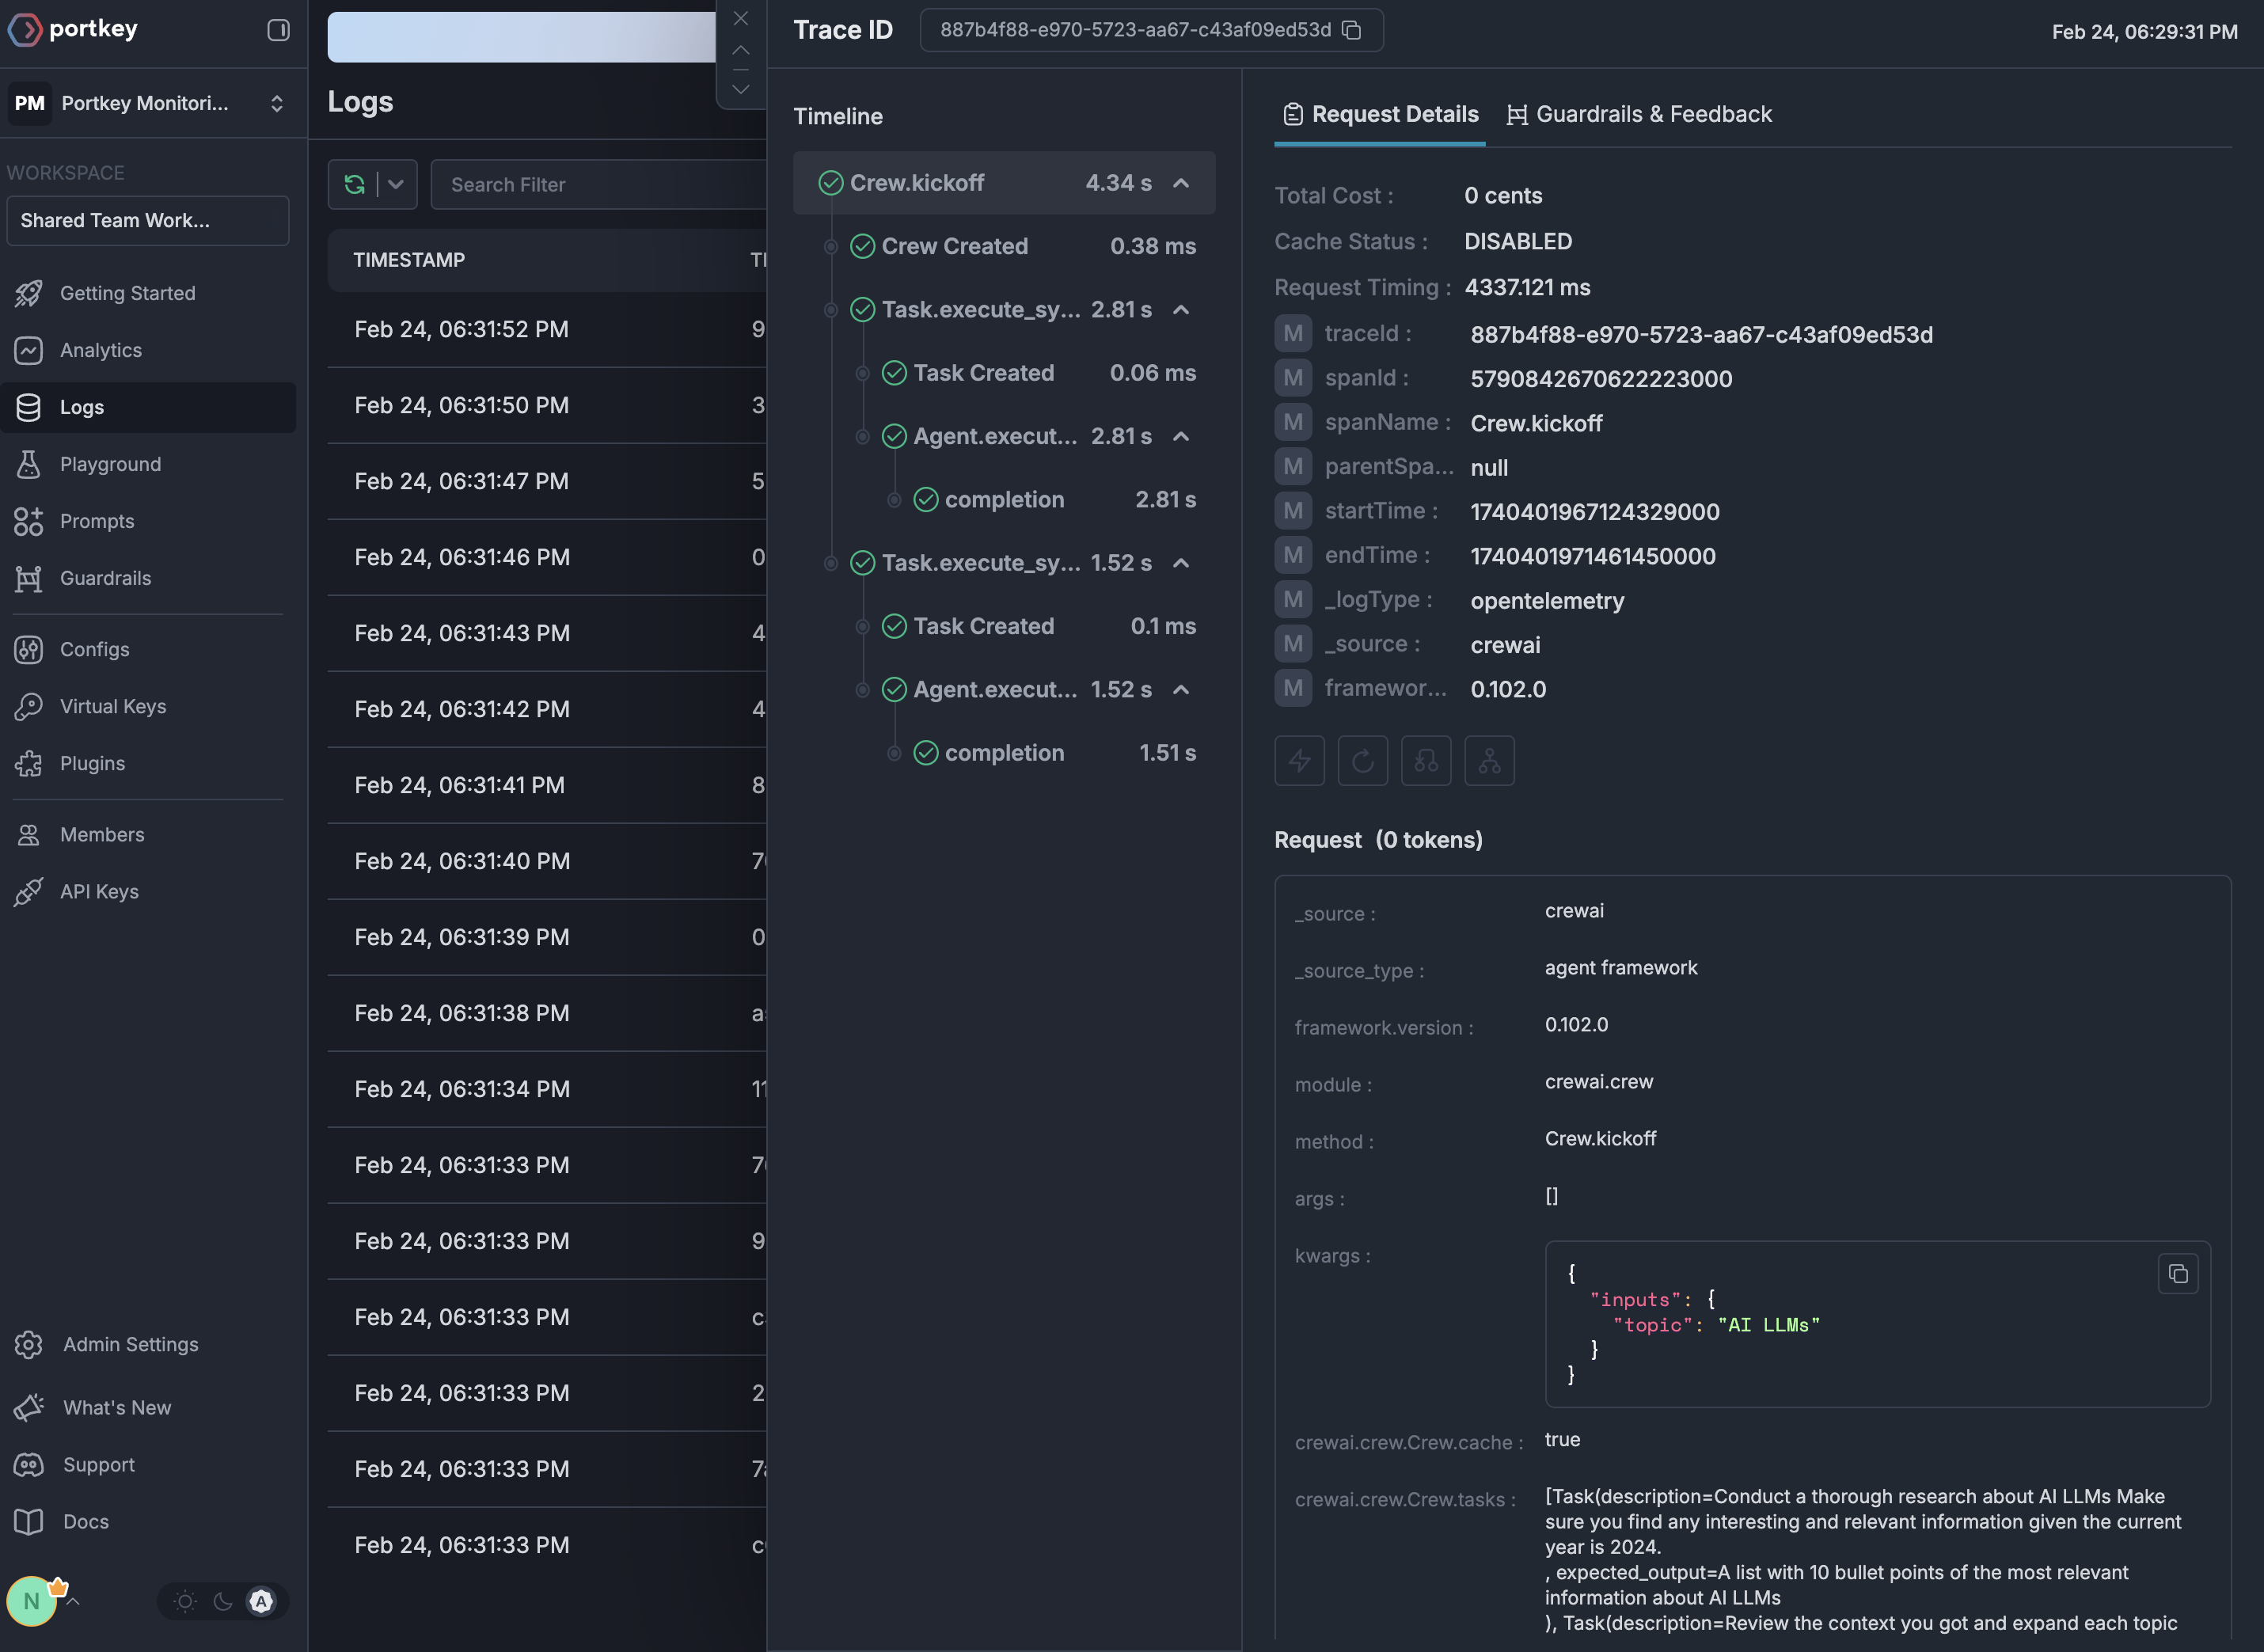
GenAI Semantic Conventions Support
Portkey automatically enriches OpenTelemetry traces with cost and token metrics following the GenAI Semantic Conventions. When you send traces with GenAI attributes, Portkey automatically:- Extracts Token Counts: Reads
gen_ai.usage.input_tokensandgen_ai.usage.output_tokensfrom trace attributes - Calculates Costs: Automatically computes costs based on token usage and model pricing
- Identifies Models & Providers: Extracts model information from
gen_ai.request.modelorgen_ai.response.modeland provider fromgen_ai.system - Enriches Analytics: Makes all trace data available for cost attribution and usage analysis
This feature is particularly powerful for applications using frameworks like LangChain, LlamaIndex, or other tools with built-in OpenTelemetry instrumentation that follow GenAI semantic conventions.
W3C Trace Context Headers
When making requests to the Portkey Gateway, you can use standard W3C trace context headers (traceparent and baggage) instead of Portkey-specific headers. This enables seamless integration with existing OpenTelemetry-instrumented applications.
traceparent: The trace ID and span ID are automatically extracted and used for Portkey’s tracingbaggage: Key-value pairs are parsed and merged into the request metadata
Why Use OpenTelemetry with Portkey?
Portkey’s OTel backend is compatible with any OTel-compliant library. Here are a few popular ones for GenAI and general application observability:Language Agnostic
Works with any programming language that supports OpenTelemetry - Python, JavaScript, Java, Go, and more
Framework Support
Compatible with all major LLM frameworks through their OTel instrumentation
Zero Code Changes
Many libraries offer auto-instrumentation that requires no changes to your application code
Standards-Based
Built on industry-standard protocols ensuring long-term compatibility
Supported OTel Libraries
Getting Started
1
Get your Portkey API key
Sign up for Portkey and grab your API key from the settings page
2
Choose an instrumentation library
Pick from our supported integrations based on your stack
3
Configure the endpoint
Point your OTel exporter to
https://api.portkey.ai/v1/logs/otel with your API key4
Start tracing
Run your application and view traces in the Portkey dashboard
Next Steps
Explore Integrations
Browse all available OpenTelemetry integrations
View Traces
Learn how to analyze traces in Portkey
Auto-Instrumentation
Discover Portkey’s native auto-instrumentation features
Get Help
Join our Discord community for support
Experimental Features
Push Logs to an OpenTelemetry compatible endpoint [Enterprise/Self-Hosted]
When enabled, Portkey Gateway pushes logs to an OpenTelemetry-compatible endpoint following the semconv 1.40.0 semantic conventions for GenAI. This includes rich attributes such as:
- Operation and provider:
gen_ai.operation.name,gen_ai.provider.name - Request attributes:
gen_ai.request.model,gen_ai.request.max_tokens,gen_ai.request.temperature,gen_ai.request.top_k, etc. - Response attributes:
gen_ai.response.id,gen_ai.response.model,gen_ai.response.finish_reasons - Token usage:
gen_ai.usage.input_tokens,gen_ai.usage.output_tokens,gen_ai.usage.cache_creation.input_tokens,gen_ai.usage.cache_read.input_tokens - Structured messages:
gen_ai.input.messages,gen_ai.output.messages,gen_ai.system_instructions - Tool definitions:
gen_ai.tool.definitions - Embeddings support:
gen_ai.request.encoding_formats,gen_ai.embeddings.dimension.count
EXPERIMENTAL_GEN_AI_OTEL_TRACES_ENABLED: Set to"true"to enable pushing logs to an OpenTelemetry endpointEXPERIMENTAL_GEN_AI_OTEL_EXPORTER_OTLP_ENDPOINT: The OpenTelemetry OTLP endpoint URL (e.g.,https://api.smith.langchain.com/otel)EXPERIMENTAL_GEN_AI_OTEL_EXPORTER_OTLP_HEADERS: Comma-separated list of headers in the formatkey=value(e.g.,x-api-key=langsmith-api-key)EXPERIMENTAL_GEN_AI_OTEL_RESOURCE_ATTRIBUTES: Comma-separatedkey=valuepairs added as OTLP resource attributes (e.g.,deployment.environment=production)
EXPERIMENTAL_GEN_AI_OTEL_EXPORTER_OTLP_ENDPOINT at the /v1/traces path.
Detailed Documentation
View comprehensive documentation including attribute mapping, span structure, and integration guides.