This feature is available for all plans:-
- Developer: 10k Logs / Month with 3 day Log Retention
- Production: 100k Logs / Month + $9 for additional 100k with 30 Days Log Retention
- Enterprise: Unlimited
How Tracing Works
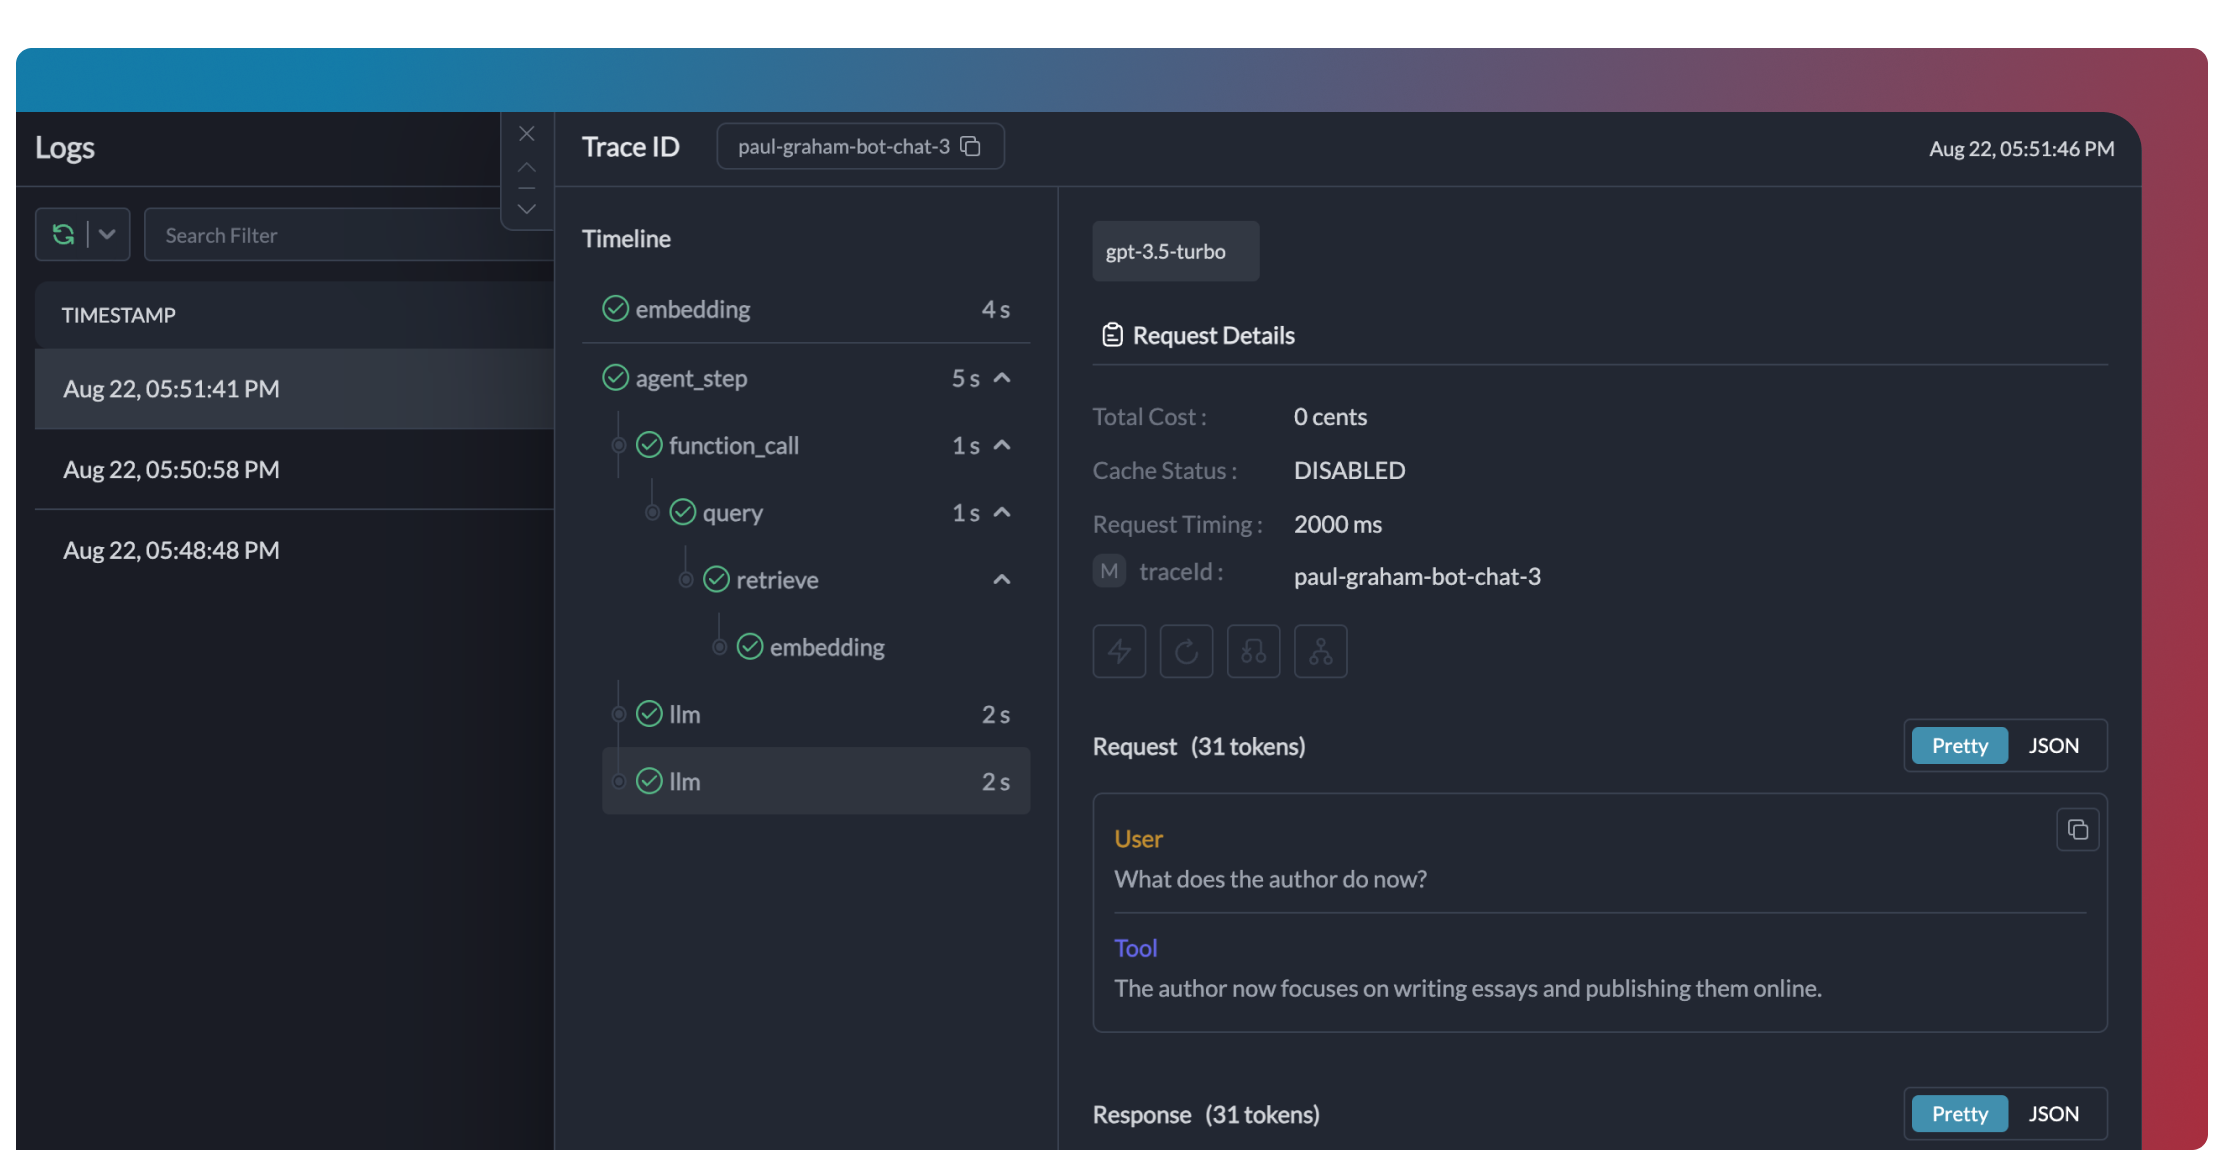
Portkey implements OpenTelemetry-compliant tracing. When you include atrace ID with your requests, all related LLM calls are grouped together in the Traces View, appearing as “spans” within that trace.
“Span” is another word for subgrouping of LLM calls. Based on how you instrument, it can refer to another group within your trace or to a single LLM call.
Trace Tree Structure
Portkey uses a tree data structure for tracing, similar to OTel. Each node in the tree is a span with a uniquespanId and optional spanName. Child spans link to a parent via the parentSpanId. Parentless spans become root nodes.
Enabling Tracing
You can enable tracing by passing thetrace tree values while making your request (or while instantiating your client).
Based on these values, Portkey will instrument your requests, and will show the exact trace with its spans on the “Traces” view in Logs page.
- NodeJS
- Python
- OpenAI NodeJS
- OpenAI Python
- cURL
Add tracing details to a single request (recommended)
Or, add trace details while instantiating your client
If you are only passing trace ID and not the span details, you can set the trace ID while making your request or while instantiating your client.
- NodeJS
- Python
- OpenAI NodeJS
- OpenAI Python
- cURL
See Tracing in Action
Tracing in Langchain
Portkey has a dedicated handler that can instrument your Langchain chains and agents to trace them.- Trace Langchain Requests (Python)
- First, install Portkey SDK, and Langchain’s packages
- Import the packages
- Instantiate Portkey’s Langchain Callback Handler
- Add the callback to the
ChatOpenAIinstance
- Also add the callback when you define or run your LLM chain
Tracing Llamaindex Requests
Portkey has a dedicated handler to instrument your Llamaindex requests on Portkey.- Trace Llamaindex Requests
- First, install Portkey SDK, and LlamaIndex packages
- Import the packages
- Instantiate Portkey’s LlamaIndex Callback Handler
- Add it to
OpenAIllm class
- In Llama Index, you can also set the callback at a global level
Inserting Logs
If you are using the Insert Log API to add logs to Portkey, yourtraceId, spanId etc. will become part of the metadata object in your log, and Portkey will instrument your requests to take those values into account.
The logger endpoint supports inserting a single log as well as log array, and helps you build traces of any depth or complexity. For more, check here:
Insert a Log
Tracing for Gateway Features
Tracing also works very well to capture the Gateway behavior on retries, fallbacks, and other routing mechanisms on Portkey Gateway. Portkey automatically groups all the requests that were part of a single fallback or retry config and shows the failed and succeeded requests chronologically as “spans” inside a “trace”. This is especially useful when you want to understand the total latency and behavior of your app when retry or fallbacks were triggered. For more, check out the Fallback & Automatic Retries docs.Why Use Tracing?
- Cost Insights: View aggregate LLM costs at the trace level.
- Debugging: Easily browse all requests in a single trace and identify failures.
- Performance Analysis: Understand your entire request lifecycle and total trace duration.
- User Feedback Integration: Link user feedback to specific traces for targeted improvements.