

MLflow offers automatic, no-code-added integrations with over 20 popular GenAI libraries, providing immediate observability with just a single line of code. Combined with Portkey’s intelligent gateway, you get comprehensive tracing enriched with routing decisions and performance optimizations.
Why MLflow + Portkey?
No-Code Integrations
Automatic instrumentation for 20+ GenAI libraries with one line of code
Detailed Execution Traces
Capture inputs, outputs, and metadata for every step
Gateway Intelligence
Portkey adds routing context, fallback decisions, and cache performance
Debug with Confidence
Easily pinpoint issues with comprehensive trace data
Quick Start
Prerequisites
- Python
- Portkey account with API key
- OpenAI API key (or add it to Model Catalog)
Step 1: Install Dependencies
Install the required packages for MLflow and Portkey integration:Step 2: Configure OpenTelemetry Export
Set up the environment variables to send traces to Portkey’s OpenTelemetry endpoint:Step 3: Enable MLflow Instrumentation
Enable automatic tracing for OpenAI with just one line:Step 4: Configure Portkey Gateway
Set up the OpenAI client to use Portkey’s intelligent gateway:Step 5: Make Instrumented LLM Calls
Now your LLM calls are automatically traced by MLflow and enhanced by Portkey:Complete Example
Here’s a full example bringing everything together:Supported Integrations
MLflow automatically instruments many popular GenAI libraries:LLM Providers
- OpenAI
- Anthropic
- Cohere
- Google Generative AI
- Azure OpenAI
Vector Databases
- Pinecone
- ChromaDB
- Weaviate
- Qdrant
Frameworks
- LangChain
- LlamaIndex
- Haystack
- And 10+ more!
Next Steps
Configure Gateway
Set up intelligent routing, fallbacks, and caching
Model Catalog
Manage AI providers, credentials, and model access centrally
View Analytics
Analyze costs, performance, and usage patterns
Set Up Budget & Rate Limits
Control costs with budget and rate limiting
See Your Traces in Action
Once configured, navigate to the Portkey dashboard to see your MLflow instrumentation combined with gateway intelligence: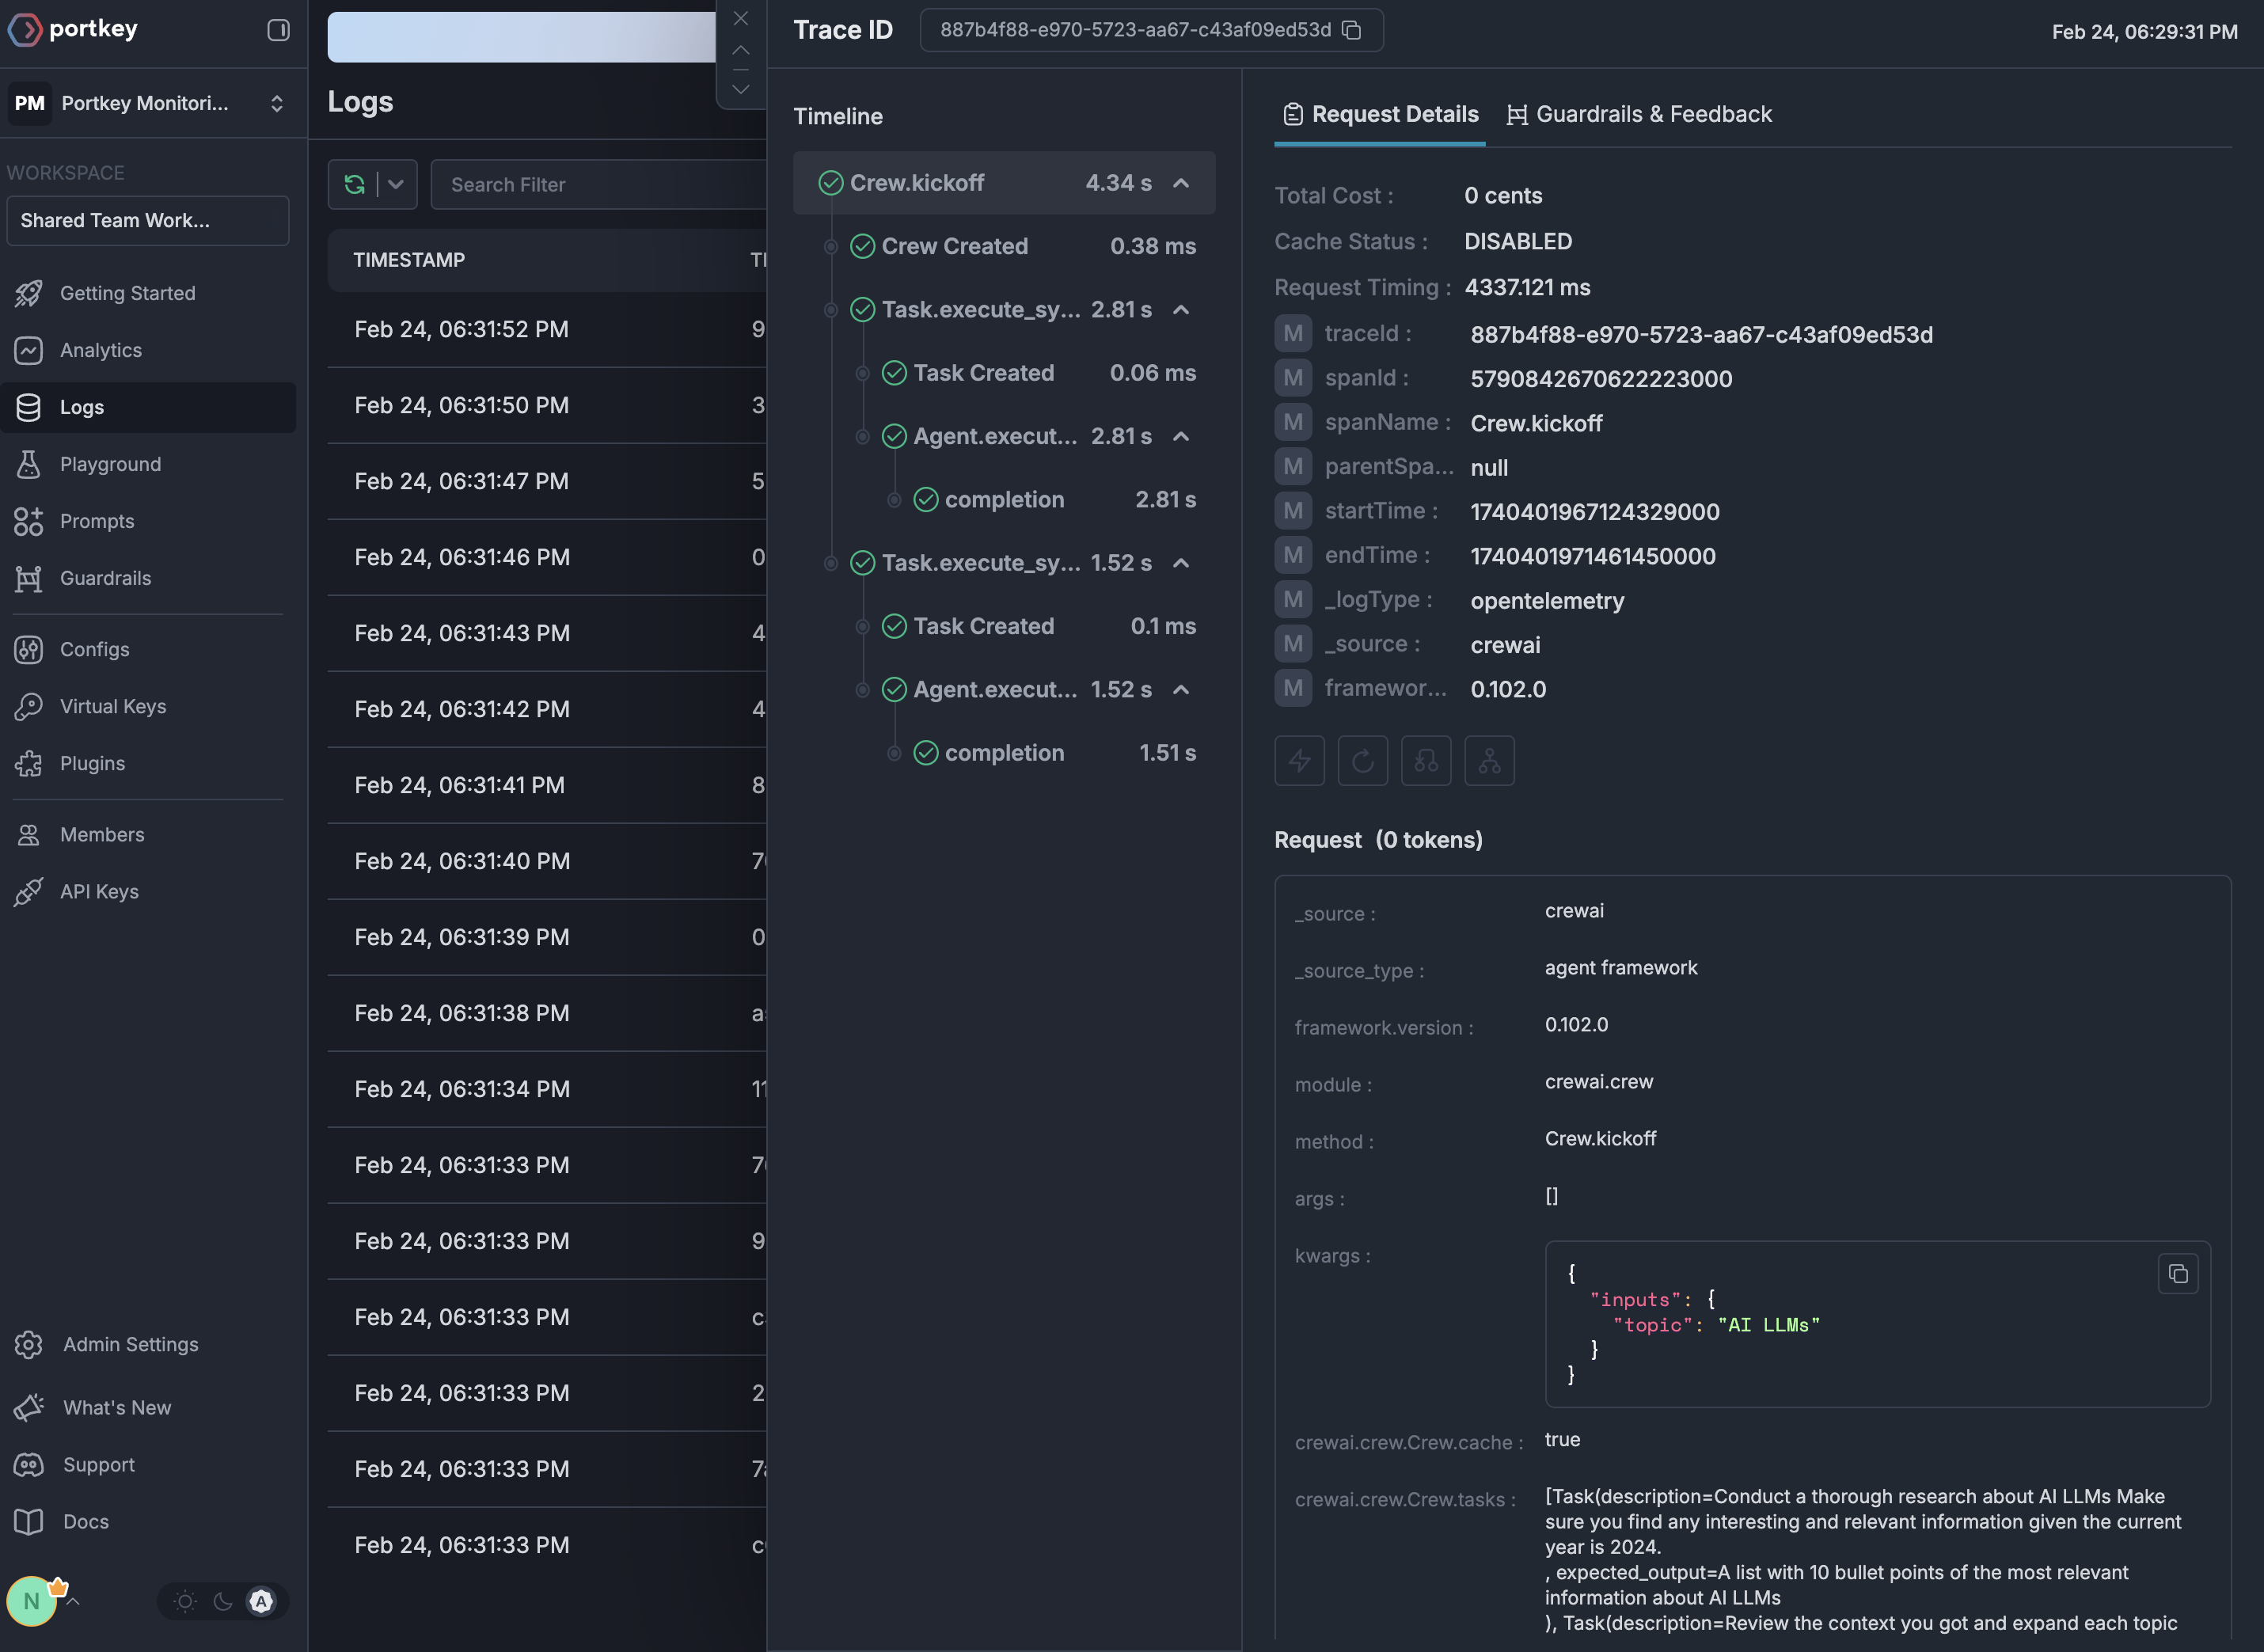
Portkey is now PRISMA AIRS AI Gateway. See it in action.
Contact Us