

Traceloop’s non-intrusive instrumentation combined with Portkey’s intelligent gateway provides comprehensive observability without modifying your application code, while adding routing intelligence, caching, and failover capabilities.
Why Traceloop + Portkey?
Non-Intrusive Monitoring
Automatic instrumentation without changing your application code
OpenTelemetry Native
Built on industry-standard OpenTelemetry for maximum compatibility
Flexible Export Options
Send traces to Portkey or any OpenTelemetry-compatible backend
Enhanced Intelligence
Portkey adds gateway features like caching, fallbacks, and load balancing
Quick Start
Prerequisites
- Python
- Portkey account with API key
- OpenAI API key (or add it to Model Catalog)
Step 1: Install Dependencies
Install the required packages for Traceloop and Portkey integration:Step 2: Initialize Traceloop
Configure Traceloop to send traces to Portkey’s OpenTelemetry endpoint:Step 3: Configure Portkey Gateway
Set up the OpenAI client to use Portkey’s intelligent gateway:Step 4: Make Instrumented LLM Calls
Your LLM calls are now automatically traced by Traceloop and enhanced by Portkey:Complete Example
Here’s a full example bringing everything together:Next Steps
Configure Gateway
Set up intelligent routing, fallbacks, and caching
Model Catalog
Manage AI providers, credentials, and model access centrally
View Analytics
Analyze costs, performance, and usage patterns
Set Up Alerts
Configure alerts for anomalies and performance issues
See Your Traces in Action
Once configured, navigate to the Portkey dashboard to see your Traceloop instrumentation combined with gateway intelligence: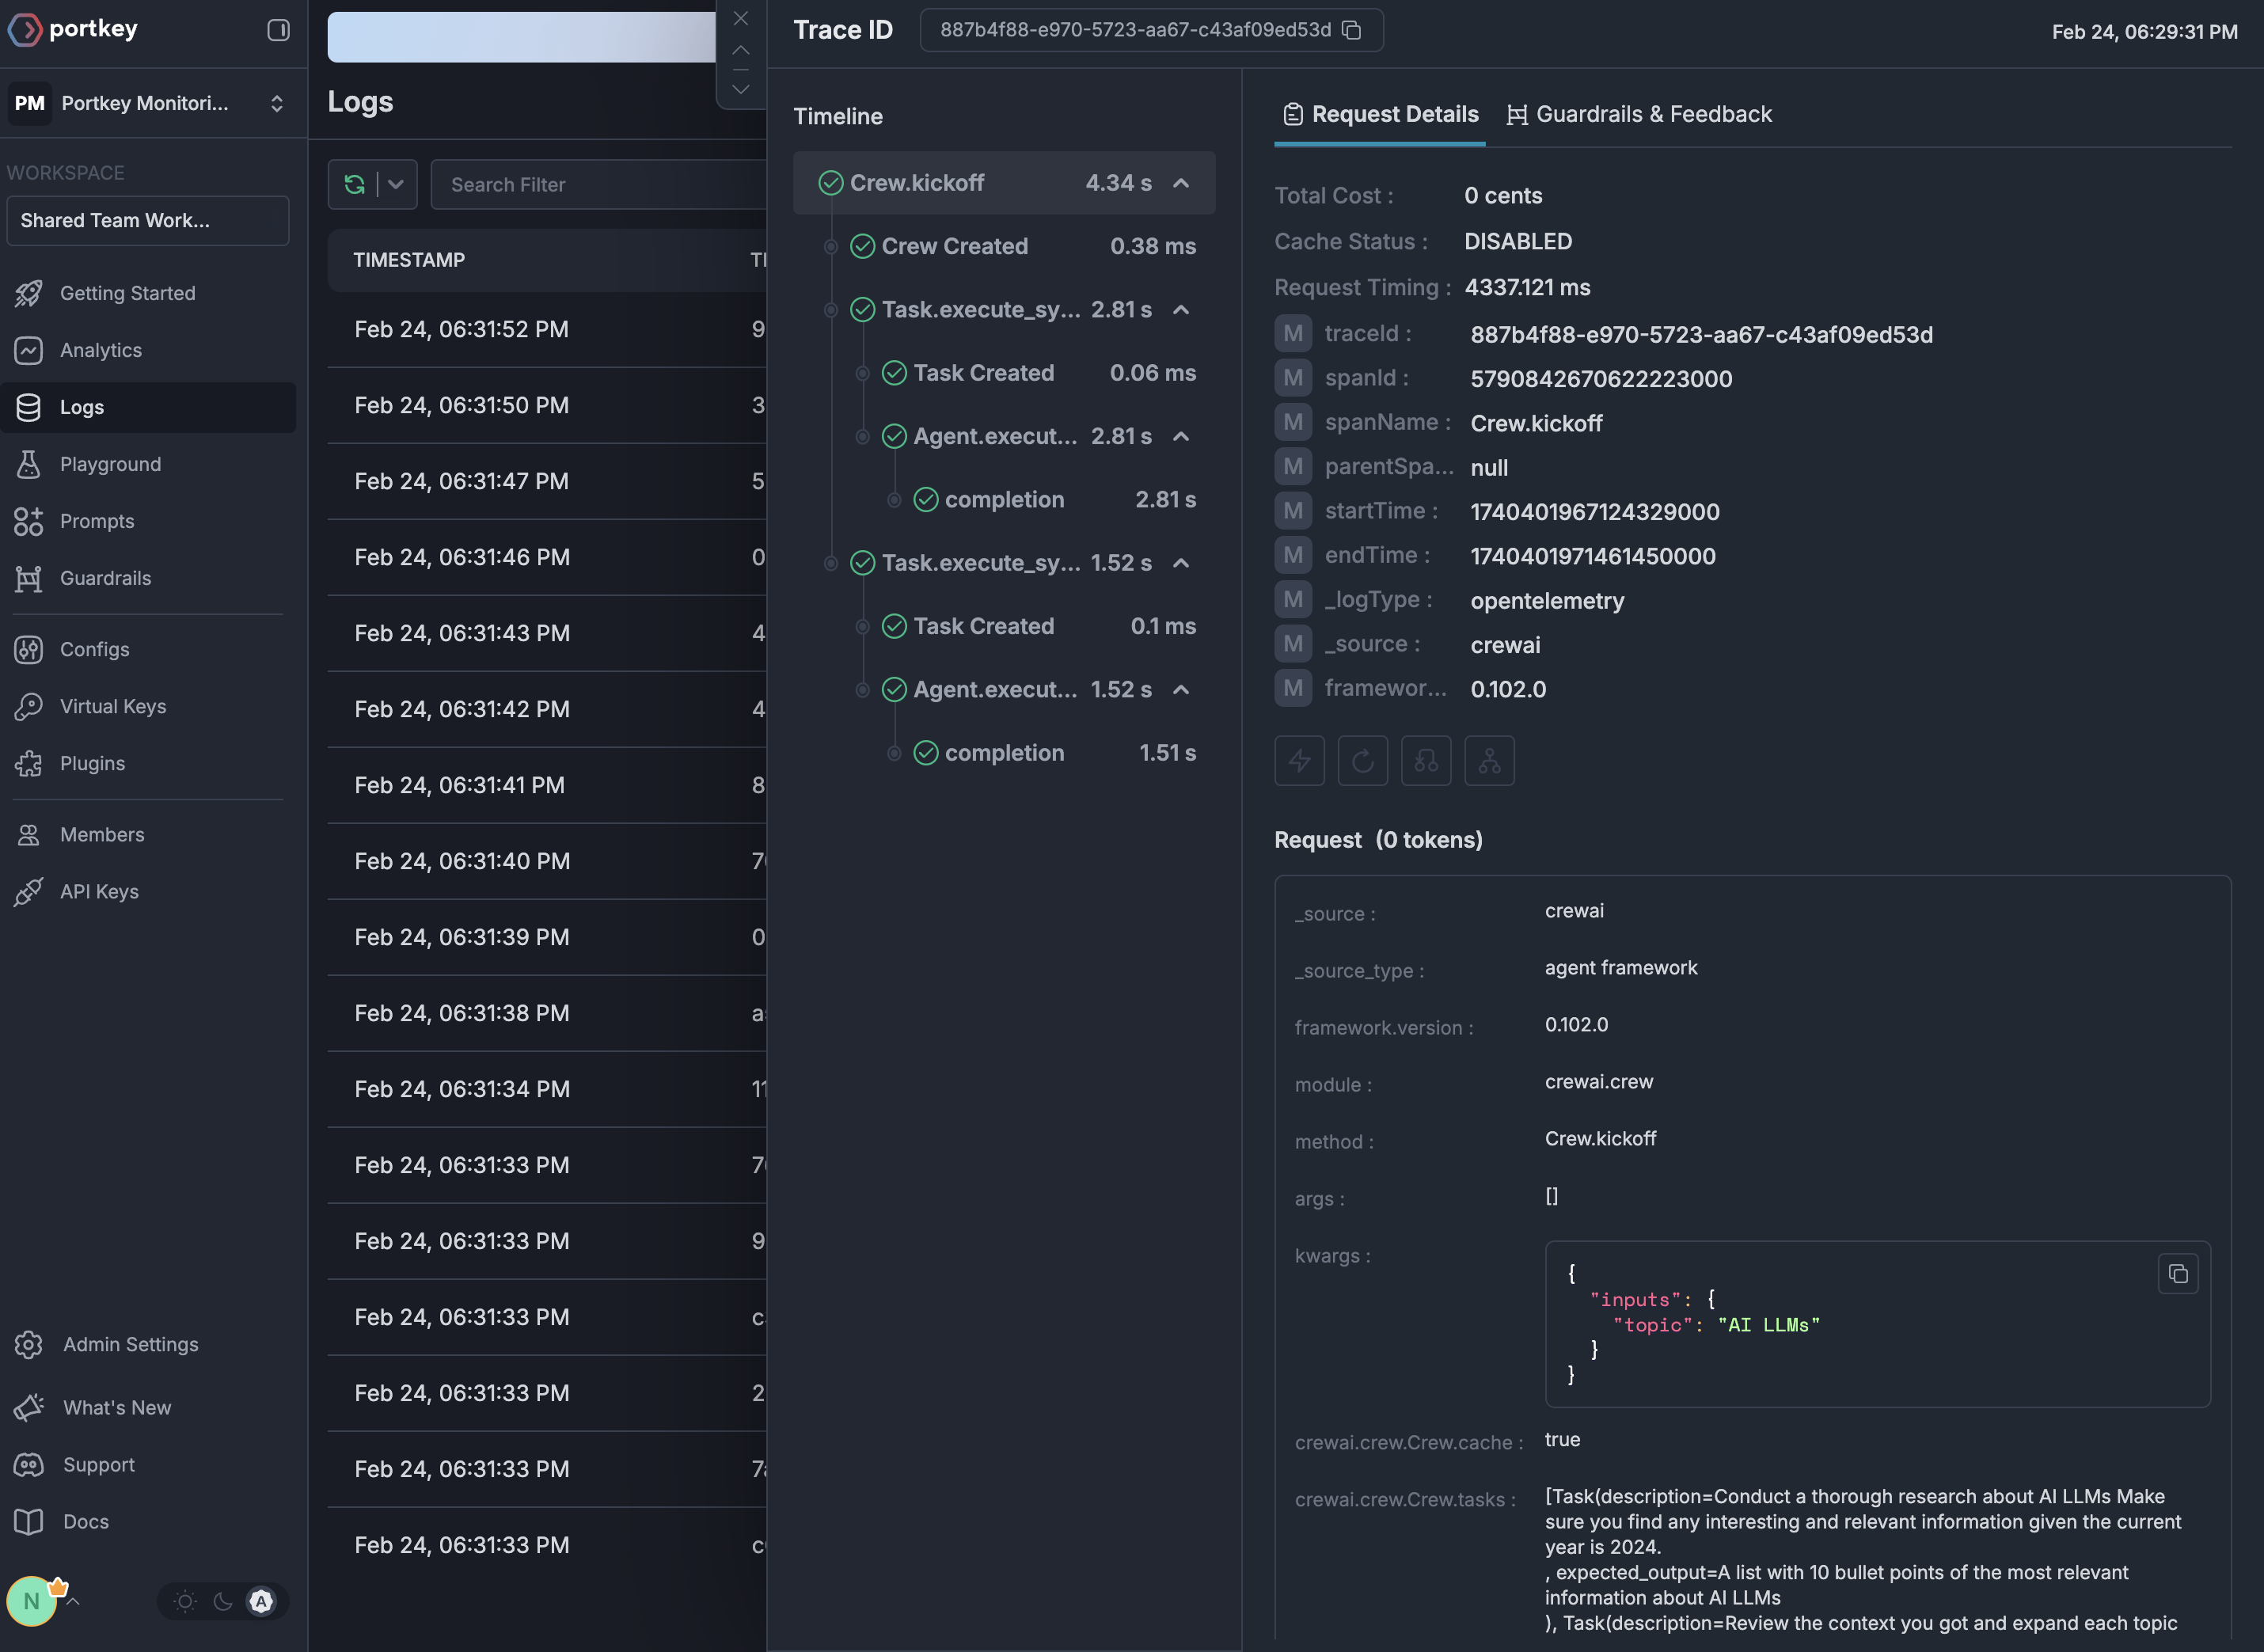
Portkey is now PRISMA AIRS AI Gateway. See it in action.
Contact Us